2005issue C091
Daily average support and Friday volume holds
A mid-2005 S&P 500 case study teaches a nested read: first confirm that a daily moving average is still acting as support, then use a late-session volume surge and a modest Friday pullback to decide whether a default flatten-at-the-close rule should be suspended through the weekend.
- Confirm the daily regime first. A moving average is acting as support when price holds above it, including an intraday poke that is reversed by the close.
- A 40-day average can be the tighter support test while a 50-day average still frames the broader advance.
- A Friday volume surge at a new session high, without a sharp late-day liquidation, tests whether participation still agrees with that support regime.
- The archive workflow then treated the first pullback in Monday's opening half hour as the default flatten point, with later same-day momentum as a possible re-entry condition.
A nested read
This archive case is a nested read. First confirm that a daily moving average is still acting as support. Then use a late-session volume surge and the depth of the Friday pullback to decide whether a default flatten-at-the-close rule should be suspended through the weekend.
A moving average is a fixed-lookback average of daily prices used as a rising support line. Support and resistance is the condition that price holds above a chosen average, including a failed intraday poke that closes back above the line and a multi-session rest on the shorter average.
Confirm daily support first
From 18 May 2005 through the early-July sample, daily S&P 500 prices stayed above the 50-day moving average except for 7 July 2005, when an intraday print below that average was reversed by the close.
On the same daily chart, the 40-day moving average tracked the June to July advance more closely as support than the 50-day average did between 24 June 2005 and 8 July 2005. The 50-day average frames the broader 2005 advance. The 40-day average is the tighter support test.
Then read Friday volume and pullback depth
On 8 July 2005, a five-minute S&P 500 e-mini chart showed a volume surge at 12:25 as a new session high formed. That session was a Friday, with about 35 minutes left until the close at the time of the late-session action, a window when a closing sell-off is often expected.
Volume-price analysis reads that short-interval volume surge at a new session high together with the absence of a sharp late-day liquidation, to test whether participation still agrees with the daily support regime.
The anticipated sharp Friday liquidation did not appear. The session produced only a modest pullback and the advance continued over the following sessions.
The next-session flatten plan
A conservative next-session plan treated the first pullback in Monday's opening half hour as the default flatten point, with later same-day momentum as a possible re-entry condition.
Editorial: after the daily averages were still acting as support, the late-Friday volume surge and the modest pullback are the archive basis for considering a weekend hold instead of flattening at the close. That pairing is an editorial teaching frame, not a claim made by the archive.
S&P 500 daily close versus the 50-day average
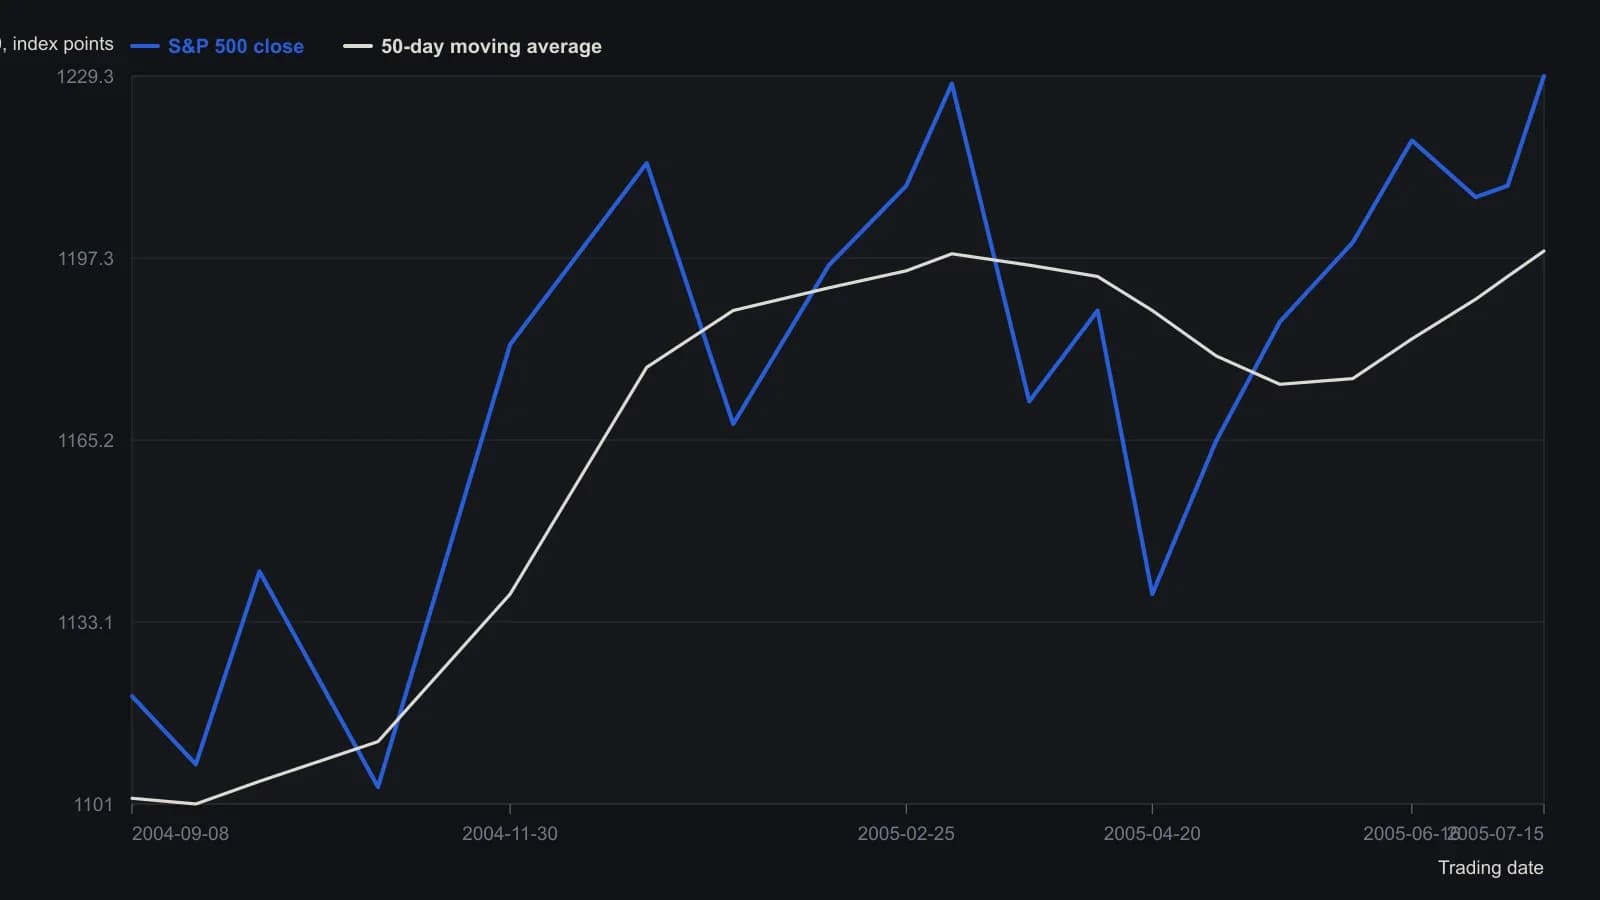
Intermediate points are digitized from the candlestick pane to the nearest index point and are approximate. Only the 15 July 2005 close (1229.35) and the labeled 50-day average (1198.49) are exact prints. The source states the index stayed above this average from 18 May 2005, with one insignificant undercut on 7 July 2005.
All readings on this track · 19 readings
- 1989T-bond volume-price boxes and a withheld rectangle top
- 1990Constructing ease of movement from volume-scaled boxes
- 1990Weekly four-stage mapping with average, range, and volume
- 1996Constructing volume-confirmed average-cross entries
- 1996Constructing four MFI bar states from range and volume
- 2001Building in-gear volume-price overlays
- 2004Constructing index volume for price-volume signals
- 2004Auditing volume-on-retest rules for prior highs and lows
- 2004Wait-rule collapse in a mistaken sale cascade
- 2005Constructing a volume and change weighted moving average
- 2005Daily average support and Friday volume holds
- 2007Match a volume-price oscillator to a range, not to a policy rebound
- 2008Volume confirms chart pattern breakouts
- 2011Color-coded volume bars for rule-based swing entries
- 2012Go or no-go checklist at repeated resistance
- 2012Pocket-pivot volume rules before a later breakout
- 2014Constructing defended price lines from volume spikes
- 2016Closing score from range location as a volume-checked sentiment filter
- 2019Volume follows price as auction state