2004issue C031-5
Constructing index volume for price-volume signals
Sector-index volume is a constructed series. Fix the aggregation rule first, then test whether the same price-volume hypothesis still holds after that rule is applied.
- Treat sector-index volume as a constructed series and choose the aggregation rule before you read a price-volume pattern.
- An end-of-day quote can include or exclude venues, portals, and sessions, and stock and index feeds from the same vendor can still define volume differently.
- An index membership change can make unaltered sequential volume look like expanding demand, while revised-composition volume can rewrite an earlier high with names that were not then in the basket.
- Capitalization-weighted volume can differ sharply from a simple share-volume sum and is designed so a split does not change a name's weight.
An end-of-day quote is not a standard object
An end-of-day quote is not a single standard object. It can include or exclude venues, electronic portals, and sessions depending on how the feed is built.
Equity quotes and sector-index quotes from the same vendor can follow different volume definitions. Stock-versus-index volume-price comparisons can conflict even when the charts look comparable.
The same index can carry several volume series
One widely used gold-and-silver index does not itself publish a total volume figure. Third-party feeds that display a volume number are applying their own construction rules.
One premium construction of that index volume sums only regular-trading-hours volume of the component stocks on the primary exchange. That is not the same definition used for ordinary stock quotes on the same site.
A portal chart of the same index can plot the host exchange's total daily volume instead of a volume series built from the index constituents.
Unaltered sequential XAU component volume, May–August 2003
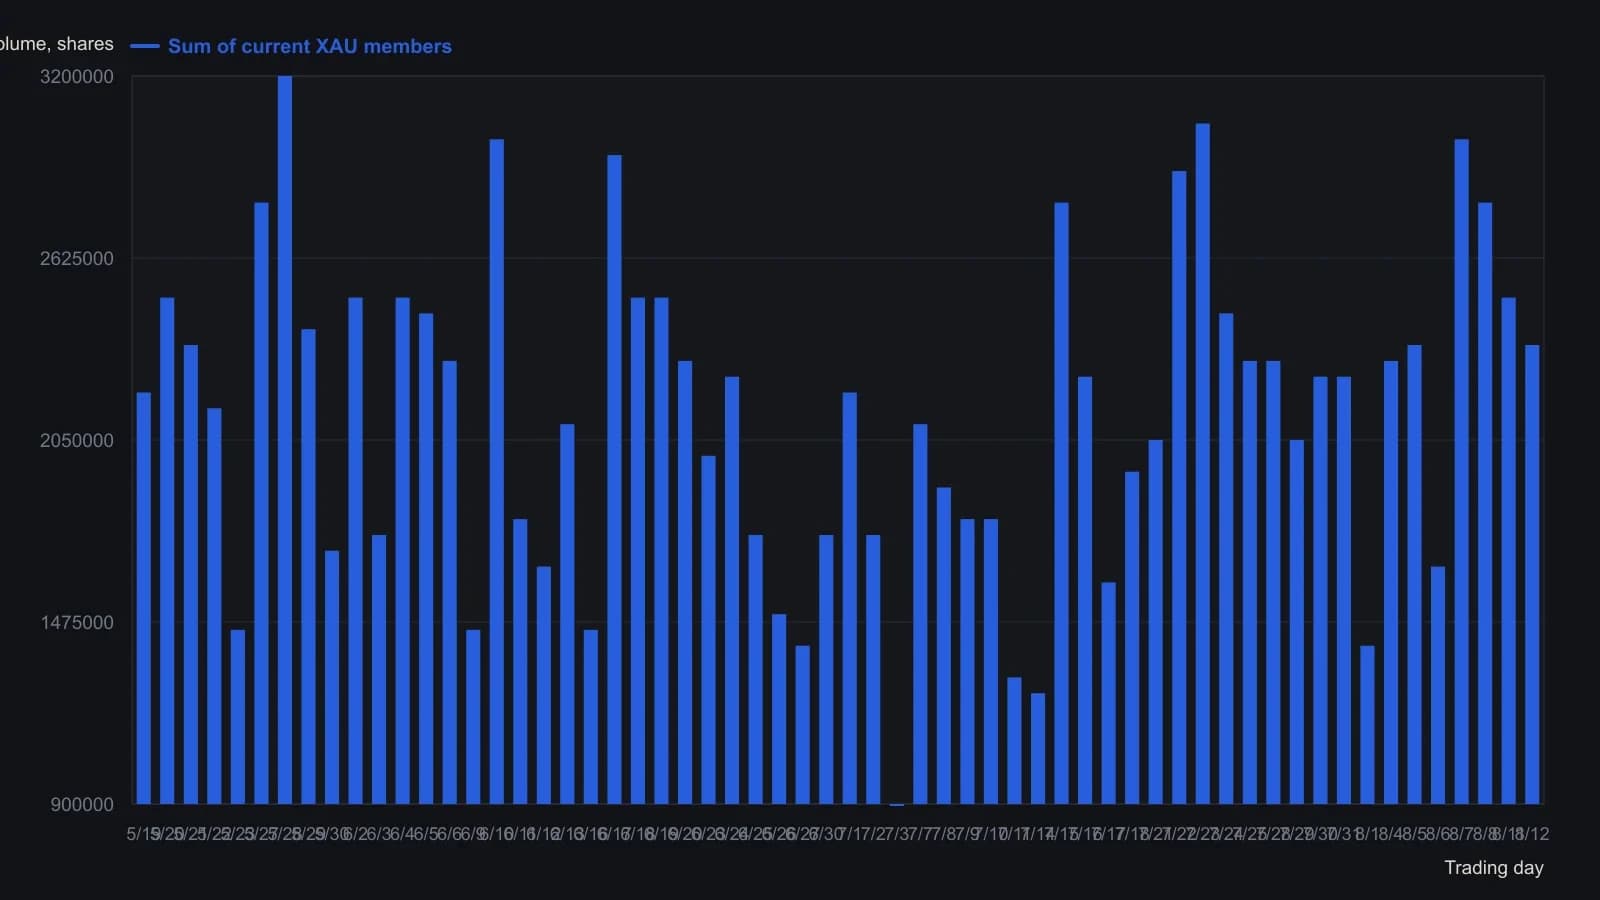
Daily bars were read off the raster to the nearest 50,000 shares. Weekend gaps in the source pane were dropped so the category axis stays in trading-day order. Memorial Day and Independence Day weeks show four bars, matching the printed chart.
An index membership change can reverse the reading
On 18 August 2003 that index changed both the number and identity of its members at a swing that volume-price analysis would treat as decision-critical. Different volume constructions then pointed to opposite trade hypotheses.
Unaltered sequential volume is the daily sum of current members using a US all-session aggregate. After an index membership change that adds a name, that series can look like expanding demand when the extra name, not greater participation, created the jump.
Revised-composition volume restates history with the later 12-name basket. That restatement can make a prior high look unmet by demand, but it also injects volume from names that were not in the index when that high printed.
Weighting should follow how the index price is built
Because the index is capitalization-weighted, a capitalization-weighted volume series can differ sharply from simple summed volume and better matches how price itself is constructed.
Simple addition of share volume passes stock-split and share-count changes straight into the index total as spikes or rank shifts. Capitalization weighting is designed to keep a split from changing a name's weight.
Editorial reading
Editorial interpretation, not an archive claim: a repeatable chart condition becomes a price-volume hypothesis only after the volume series is defined. If switching among unaltered sequential volume, revised-composition volume, and capitalization-weighted volume flips confirmation into denial, the pattern has not yet been made falsifiable.
All readings on this track · 19 readings
- 1989T-bond volume-price boxes and a withheld rectangle top
- 1990Constructing ease of movement from volume-scaled boxes
- 1990Weekly four-stage mapping with average, range, and volume
- 1996Constructing volume-confirmed average-cross entries
- 1996Constructing four MFI bar states from range and volume
- 2001Building in-gear volume-price overlays
- 2004Constructing index volume for price-volume signals
- 2004Auditing volume-on-retest rules for prior highs and lows
- 2004Wait-rule collapse in a mistaken sale cascade
- 2005Constructing a volume and change weighted moving average
- 2005Daily average support and Friday volume holds
- 2007Match a volume-price oscillator to a range, not to a policy rebound
- 2008Volume confirms chart pattern breakouts
- 2011Color-coded volume bars for rule-based swing entries
- 2012Go or no-go checklist at repeated resistance
- 2012Pocket-pivot volume rules before a later breakout
- 2014Constructing defended price lines from volume spikes
- 2016Closing score from range location as a volume-checked sentiment filter
- 2019Volume follows price as auction state