2001issue C101-4
Building in-gear volume-price overlays
A volume-first scaffold marks consecutive expansion, contraction, and steady volume stretches, confirms those phases, then tests whether price is still traveling with volume so an exhaustion, climax, or comfort-zone call can be stated as a chart hypothesis.
- A volume-first scan marks consecutive rising, falling, and steady volume stretches on a span of about six months and confirms those phases with a 10-day moving average of volume before any price trendline is drawn.
- An in-gear reading is constructed when price and volume rise together or fall together. An out-of-gear reading is constructed when they move in opposite directions. Neither alignment is treated as a permanent state.
- A single price trend can contain both in-gear and out-of-gear segments, so an exhaustion top, selling climax, or comfort-zone level is named only after the matching volume stretch has been confirmed.
- A one- to four-day pickup in selling during an advance can leave the prior path intact as profit-taking, while selling that persists for weeks or months is treated as a broader-condition signal.
A two-layer volume-price scaffold
The overlay is a joint reading of price and volume, not a single finished line. An in-gear reading is constructed when the two move in the same direction: rising together, or falling together. An out-of-gear reading is constructed when they move in opposite directions: price up with volume down, or price down with volume up.
Neither an in-gear nor an out-of-gear alignment is treated as a permanent state. Both are expected to give way.
Mark volume stretches first
A volume-first scan uses a span of about six months. Consecutive days of rising or falling volume are marked, and stretches of steady volume are marked as well. Those phases are confirmed with a 10-day moving average of volume.
Price trendlines are drawn only after that confirmation, and only across the matching spans. Editorial note: this order keeps the activity phases from being redrawn to fit a price line that was sketched first.
Build the in-gear and out-of-gear overlay
Once the volume stretches are confirmed, price is tested against them. Higher prices with higher activity, or lower prices with quieter activity, construct an in-gear move. Higher prices on shrinking activity, or lower prices on expanding activity, construct an out-of-gear move.
A single price trend can contain both segments. One described case is a decline that starts with falling volume and finishes with rising volume. Rising price on shrinking volume is framed as remaining buyers acting from greed. Falling price on expanding volume is framed as sellers acting from fear.
America Online daily share price, January–July 2000
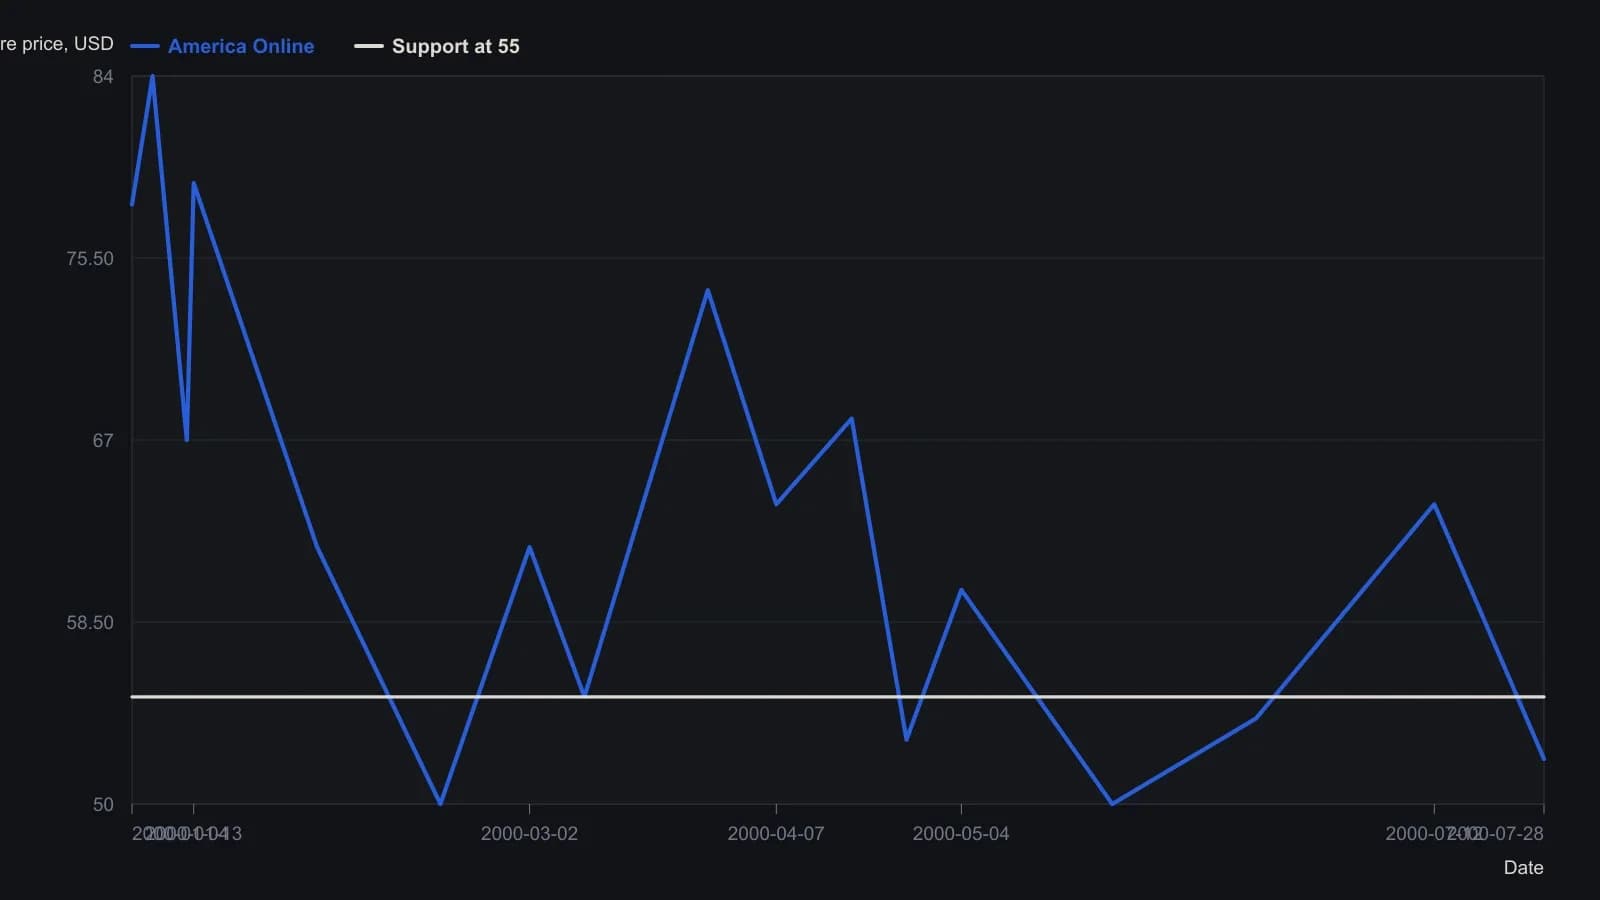
Visible turning points only; gaps between swings were not interpolated. Prices rounded to the nearest dollar except the quoted last close.
Specify extremes and selling duration
An exhaustion top is specified as a two- to five-day surge in both price and volume. A selling climax is specified as a two- to five-day price drop with a sudden volume surge. Editorial note: those labels belong to a confirmed short stretch, not to the whole trend that contains them.
A one- to four-day pickup in selling during an advance is treated as profit-taking that can leave the prior path intact. Selling that persists for weeks or months is treated as a broader-condition signal rather than a brief pause.
Sketch the comfort zone and overhead supply
The comfort-zone price is the level associated with ordinary in-gear selling rather than panic or scarcity. A 20-day or 50-day price average is described as a rough sketch of that zone.
A top is described as forming either through a buying frenzy lasting a few days or through a scarcity of sellers that usually takes a week or more. Heavy overhead supply, prior trading concentrated above the current price, is said to reduce breakout odds and to explain why broken support can later act as resistance.
State a falsifiable chart hypothesis
Editorial reading: after the volume-first scan is confirmed and the price overlay is in place, the chart claim is written so it can later be true or false. The claim stays inside the construction: price and volume are still in gear; the advance is stretching into a two- to five-day exhaustion top; the decline is stretching into a selling climax; price is back at the comfort zone of ordinary in-gear selling; or overhead supply still sits above the market.
Because both alignments are expected to give way, the next confirmed volume stretch restarts the test. The overlay is rebuilt from that stretch rather than kept as a standing label.
All readings on this track · 19 readings
- 1989T-bond volume-price boxes and a withheld rectangle top
- 1990Constructing ease of movement from volume-scaled boxes
- 1990Weekly four-stage mapping with average, range, and volume
- 1996Constructing volume-confirmed average-cross entries
- 1996Constructing four MFI bar states from range and volume
- 2001Building in-gear volume-price overlays
- 2004Constructing index volume for price-volume signals
- 2004Auditing volume-on-retest rules for prior highs and lows
- 2004Wait-rule collapse in a mistaken sale cascade
- 2005Constructing a volume and change weighted moving average
- 2005Daily average support and Friday volume holds
- 2007Match a volume-price oscillator to a range, not to a policy rebound
- 2008Volume confirms chart pattern breakouts
- 2011Color-coded volume bars for rule-based swing entries
- 2012Go or no-go checklist at repeated resistance
- 2012Pocket-pivot volume rules before a later breakout
- 2014Constructing defended price lines from volume spikes
- 2016Closing score from range location as a volume-checked sentiment filter
- 2019Volume follows price as auction state