1998issue C051-6
A weekly composite-score that classifies despair, euphoria, or neither
This article teaches how a seven-component weekly composite-score classified despair-climate, euphoria-climate, or an abstention-band, then placed one S&P 500 exposure inside that climate rather than treating every price break as a new trade.
- The composite-score issued a buy climate only when the summed votes reached 10 or more and a sell climate only when the sum fell to 4 or less, so mid-range totals stayed in the abstention-band.
- Each component voted 2 under a buy rule and 0 under a sell rule, which made the weekly procedure a scored checklist rather than a single-indicator trigger.
- The price-filter was one moving-average vote inside the composite. After the 1997 sell climate a 20-week average was used only as a confirming regime filter, not as the whole system.
- The one-year-review checked whether the S&P 500 was higher after buy climates. It was not a rule for sizing a live position.
Climate first, then the single exposure
Editorial aim: show how a weekly sentiment-and-price composite can classify market climate as despair-climate, euphoria-climate, or neither, then place a single equity-index exposure inside that regime instead of treating every price break as a new trade.
The archive workflow used a seven-component weekly composite-score. A climate turned on only after enough component votes agreed.
How the composite-score worked
Each component voted 2 under a buy rule and 0 under a sell rule, so the procedure was a scored checklist rather than a single-indicator trigger.
The composite issued a buy climate when the summed votes reached 10 or more and a sell climate when the sum fell to 4 or less. Mid-range totals formed the abstention-band and withheld both climates so the procedure could stay flat.
The listed buy-side and sell-side votes
Buy-side votes included a 13-week advisory-bull ratio at or below 40 percent, a four-week bullish-ad average at or below 7, a Friday put/call reading at or above 0.50, futures bullish-consensus readings at or below 40 percent, and the S&P 500 above its 20-day average.
Sell-side votes reversed those thresholds: advisory bulls at or above 70 percent, bullish ads at or above 15, Friday put/call at or below 0.40, futures consensus at or above 70 percent, and the S&P 500 below its 20-day average.
Editorial label: the S&P 500 test against its 20-day average is the price-filter. It is one short-term moving-average vote inside the composite, not a standalone forecast.
A one-year-review of buy climates
From 26 August 1988 through 18 April 1997 the composite produced 37 buy climates. 35 of those dates were followed by a higher S&P 500 one year later, with two dated exceptions on 8 December 1989 and 26 November 1993.
Among the 35 buy climates later followed by a higher index, the one-year S&P 500 change ranged from +2.03 percent to +42.96 percent.
The one-year-review is a fixed post-signal window used only to check whether the subsequent index path was higher or lower, not to size a live position.
S&P 500 one year after Super Seven buy signals
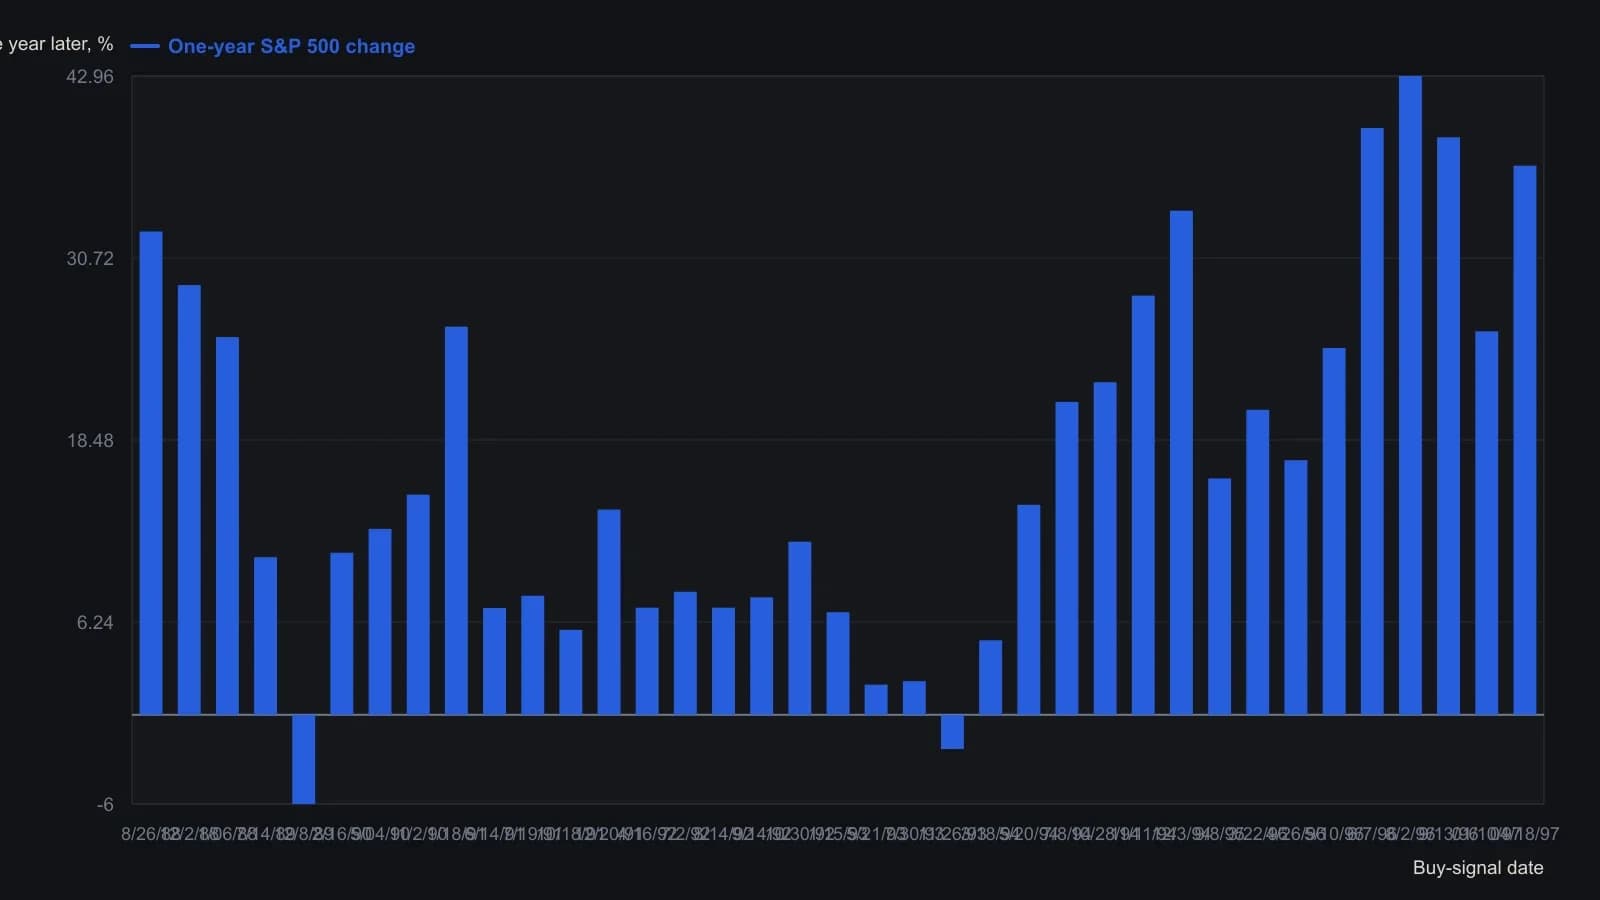
The 18 April 1997 outcome is the source's mark-to-market as of 28 February 1998, not a completed year.
Reading a despair-climate against the tape
The 2 November 1990 buy climate formed after a geopolitical shock, rising rates, and clustered pessimism. The archive presented that date as a case of reading despair against the prevailing news tape.
Despair-climate here means a cluster of pessimistic survey, advertising, and options readings that historically preceded buy-side review rather than guaranteed higher prices.
Sell climates, then a confirming average
The first sell climate arrived on 1 August 1997, with additional sell climates on 26 December 1997 and 7 January 1998. A large Dow decline on 27 October 1997 followed the August signal, while the S&P 500 later made new highs by 5 March before the composite flipped again on 7 March.
A short-horizon moving-average confirmation was used after the 1997 sell climate. The index was still above a 20-week average on 1 August 1997 and then fell through that average. The archive treated that average as a regime filter rather than the whole system.
Euphoria-climate here means a cluster of uniformly bullish survey, advertising, and options readings that historically preceded profit-taking review rather than guaranteed lower prices.
Editorial reading of the regime around one book
Editorial interpretation: the weekly composite-score functions as a climate label around one S&P 500 exposure. A despair-climate marks a buy-side review. A euphoria-climate marks a profit-taking review. An abstention-band marks a flat book.
Editorial interpretation: the later 20-week average can confirm that a sell climate has begun to appear in price. It remains a filter around the composite-score, not a replacement for the seven-component vote, and it is not a new trade each time price crosses a shorter average.
All readings on this track · 20 readings
- 1986A pre-trade checklist for crowded trading methods
- 1988Contrary decision process versus lagging bullish consensus
- 1988Constructing contrarian signals from polled consensus
- 1989Constructing a ten-input breadth diffusion score
- 1989Even-number first penetration as a construction problem
- 1991Joint strength and sentiment rules for entries and exits
- 1995Evaluating contrarian sentiment thresholds for bond futures
- 1998A weekly composite-score that classifies despair, euphoria, or neither
- 1998Lagged phase clocks for market cycles
- 2003Process rules when a correct view fails
- 2003Closing stops and equity-curve filters as one decision process
- 2003One procedure for entry, exit, and standing aside
- 2004Cross-index volatility gauges as a premium regime map
- 2005When trend rules need a losing filter
- 2006Evaluating sector breadth as a contrarian regime filter
- 2011Sideline patience versus crowd noise
- 2012Assembling a sentiment zone oscillator as one contrarian filter
- 2012Currency regime context for fading rallies
- 2014When late trend confirmation is a sideline signal
- 2017Write a daily contrarian rule from the closed-end-fund discount