2012issue C0562-71
Assembling a sentiment zone oscillator as one contrarian filter
A sentiment zone oscillator is assembled from a signed period count, a fourteen-period triple exponential moving average, and thirty-period extreme bands. Packaged applications then attach zero-line, trend, and fixed-seven crossing rules to that same series.
- The sentiment zone oscillator marks overbought and oversold zones from ordered price observations and is scaled from plus one hundred to minus one hundred.
- One construction applies a fourteen-period triple exponential moving average to the signed period count, then scales the result by one hundred divided by that lookback.
- Dynamic overbought-oversold bands use a thirty-period extreme window inset by ninety-five percent of the range, while other setups plot fixed-seven thresholds.
- One coded strategy joins those bands to a thirty-period oscillator average and a sixty-period exponential average of price, while a separate reconstruction uses only the fixed-seven thresholds.
Overbought and oversold zones from ordered prices
The sentiment zone oscillator is constructed to mark overbought and oversold zones and potential entry or exit areas from ordered price observations.
It is described as a contrary measure of extreme optimism and pessimism on a vertical scale from plus one hundred to minus one hundred, with the zero line treated as unimportant.
Signed period count and triple smoothing
One implementation first takes the sign of the current price change. That signed period count records whether the chosen price series rose or fell from the prior bar before any smoothing or scaling.
A fourteen-period triple exponential moving average is then applied to the signed-move series so that short-lived reversals are damped. The smoothed result is scaled by one hundred divided by that lookback.
The construction is presented as a back-count of rising versus falling periods tempered by a smoothed exponential average so that brief reversals are less likely to generate signals.
Rolling extremes and fixed-seven thresholds
Dynamic overbought-oversold bands are built from the highest and lowest oscillator values over a thirty-period window, then inset by ninety-five percent of that range.
Several implementations also plot fixed-seven thresholds at plus seven and minus seven as alternative overbought and oversold markers.
Daily SZO on the Dow with 95-percent bands and plus seven
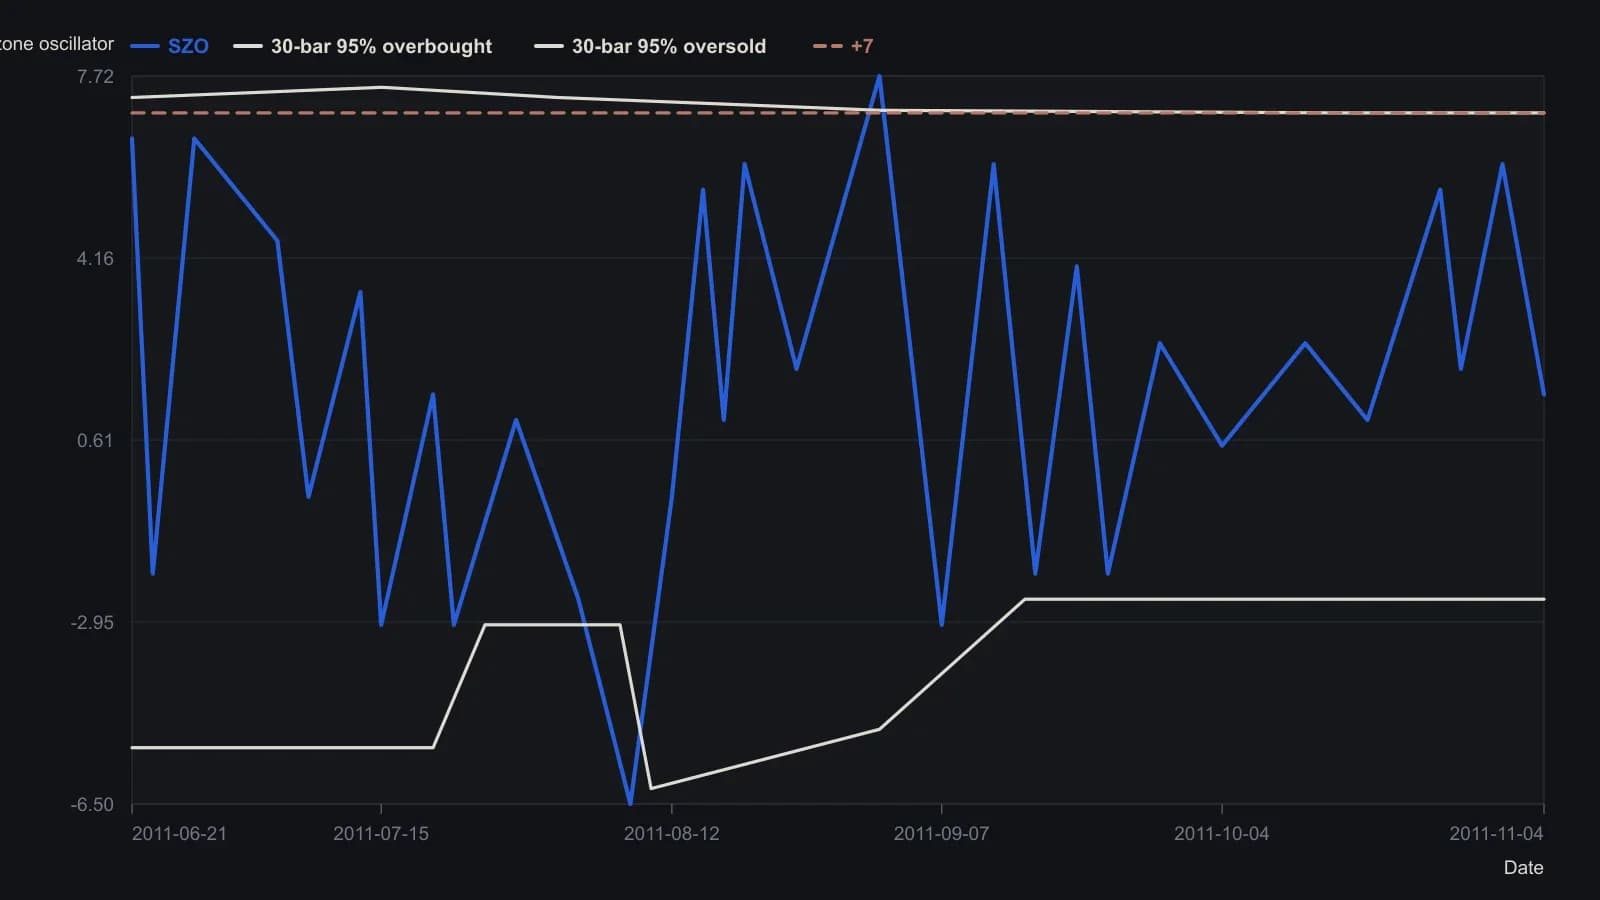
SZO is 100 times a 14-period TEMA of the signed close change, divided by 14. Rolling bands use a 30-period high/low of SZO at 95 percent of that range. Fixed guides sit at +7 and −7. Dates are interpolated from the July–October axis labels; the raster does not support bar-by-bar timing.
One coded set of contrarian crossing rules
Several packaged implementations treat the oscillator as a leading contrarian study and pair it with an automated strategy that backtests the author's recommended application.
One coded strategy buys when a thirty-period average of the oscillator crosses above zero with price above a sixty-period exponential average, when price is above that average while the oscillator is below its dynamic oversold line and the thirty-period average is rising, or when that average is above zero, the oscillator crosses above the dynamic oversold line, and the sixty-period exponential average is rising.
The same strategy sells when the thirty-period oscillator average crosses above zero or when the oscillator crosses below plus seven while that average is falling.
Another use of the plus-seven and minus-seven lines
A separate reconstruction states that a crossing above plus seven is treated as an overbought buy cue and a crossing below minus seven as an oversold sell cue.
Editorial: test the construction as one procedure
TradersWeek editorial interpretation: the archive presents more than one way to turn the same oscillator into entries and exits. Dynamic overbought-oversold bands, a thirty-period oscillator average, a sixty-period price trend filter, and the fixed-seven thresholds are not interchangeable fragments.
A thirty-period average crossing above zero appears in both the buy list and the sell list of the same coded strategy, and the separate reconstruction treats plus seven and minus seven as the opposite pair of cues. Those construction choices should be checked as one set of contrarian crossing rules rather than as isolated formula fragments.
All readings on this track · 20 readings
- 1986A pre-trade checklist for crowded trading methods
- 1988Contrary decision process versus lagging bullish consensus
- 1988Constructing contrarian signals from polled consensus
- 1989Constructing a ten-input breadth diffusion score
- 1989Even-number first penetration as a construction problem
- 1991Joint strength and sentiment rules for entries and exits
- 1995Evaluating contrarian sentiment thresholds for bond futures
- 1998A weekly composite-score that classifies despair, euphoria, or neither
- 1998Lagged phase clocks for market cycles
- 2003Process rules when a correct view fails
- 2003Closing stops and equity-curve filters as one decision process
- 2003One procedure for entry, exit, and standing aside
- 2004Cross-index volatility gauges as a premium regime map
- 2005When trend rules need a losing filter
- 2006Evaluating sector breadth as a contrarian regime filter
- 2011Sideline patience versus crowd noise
- 2012Assembling a sentiment zone oscillator as one contrarian filter
- 2012Currency regime context for fading rallies
- 2014When late trend confirmation is a sideline signal
- 2017Write a daily contrarian rule from the closed-end-fund discount