1989issue C011-5
Constructing a ten-input breadth diffusion score
A weekly market-breadth stance can be built as a ten-input diffusion score. Each moving-average stretch, participation rule, contrary-crowding ratio, and policy-tightness reading publishes bullish, bearish, and abstain bands before those votes are netted, so the composite can be audited and the procedure remains falsifiable.
- A diffusion score subtracts the count of bearish component readings from the count of bullish ones and leaves neutral readings out of the arithmetic.
- Each moving-average stretch, market-breadth rule, and contrary-crowding input must publish bullish, bearish, and abstain bands before those votes are netted.
- The finished score is mapped onto a ladder from +5 through -5, with +1, 0, and -1 grouped as a single neutral band.
- A weekly stance test records a bullish or bearish reading each week and later checks it against subsequent market direction over 13 weeks, 26 weeks, or one year.
How the diffusion score is counted
A ten-component consensus reading is formed by subtracting the count of bearish technical inputs from the count of bullish inputs, so neutral readings do not change the net score.
In a worked construction example, five bullish inputs, four neutrals, and one bearish input produce a net score of 4.
The finished score is mapped onto a ladder from +5 through -5, with +1, 0, and -1 grouped as a single neutral band.
A moving-average stretch
One moving-average component compares a major industrial average with its 30-day average and treats a reading below -3 percent as bullish and a reading above +3 percent as bearish.
Market-breadth participation rules
Participation rules use 10-day averages of new highs versus new lows and a 10-day advances-minus-declines total that becomes active only after the series crosses +1000 or -1000 and then retraces 1000 points from the later extreme.
A 10-day average of advancing-share volume versus declining-share volume is scored bullish above 120 percent and bearish below 80 percent.
A separate overlay turns bullish only when fewer than 30 percent of listed stocks sit below their 10-week average and fewer than 40 percent sit below their 30-week average.
Contrary-crowding votes
Four contrary components convert option-premium imbalance, letter-writer pessimism, speculative-versus-seasoned volume, and insider sell-to-buy activity into votes. Letter-writer pessimism is counted as the bearish share plus half the correction share.
Each of those ratios casts a vote only after it leaves a published middle band.
A policy-tightness ratio
A policy-tightness component averages the funds-rate-to-discount-rate ratio on Friday, Monday, Tuesday, and Thursday, and omits Wednesday because of individual-bank distortion.
Readings below 103 percent are scored bullish. Readings above 125 percent are scored bearish.
The weekly stance test
The checking procedure asked each indicator for a weekly bullish or bearish stance and judged that stance by later market direction over 13 weeks, 26 weeks, or one year.
Ten-year batting average of the Wall Street Week index
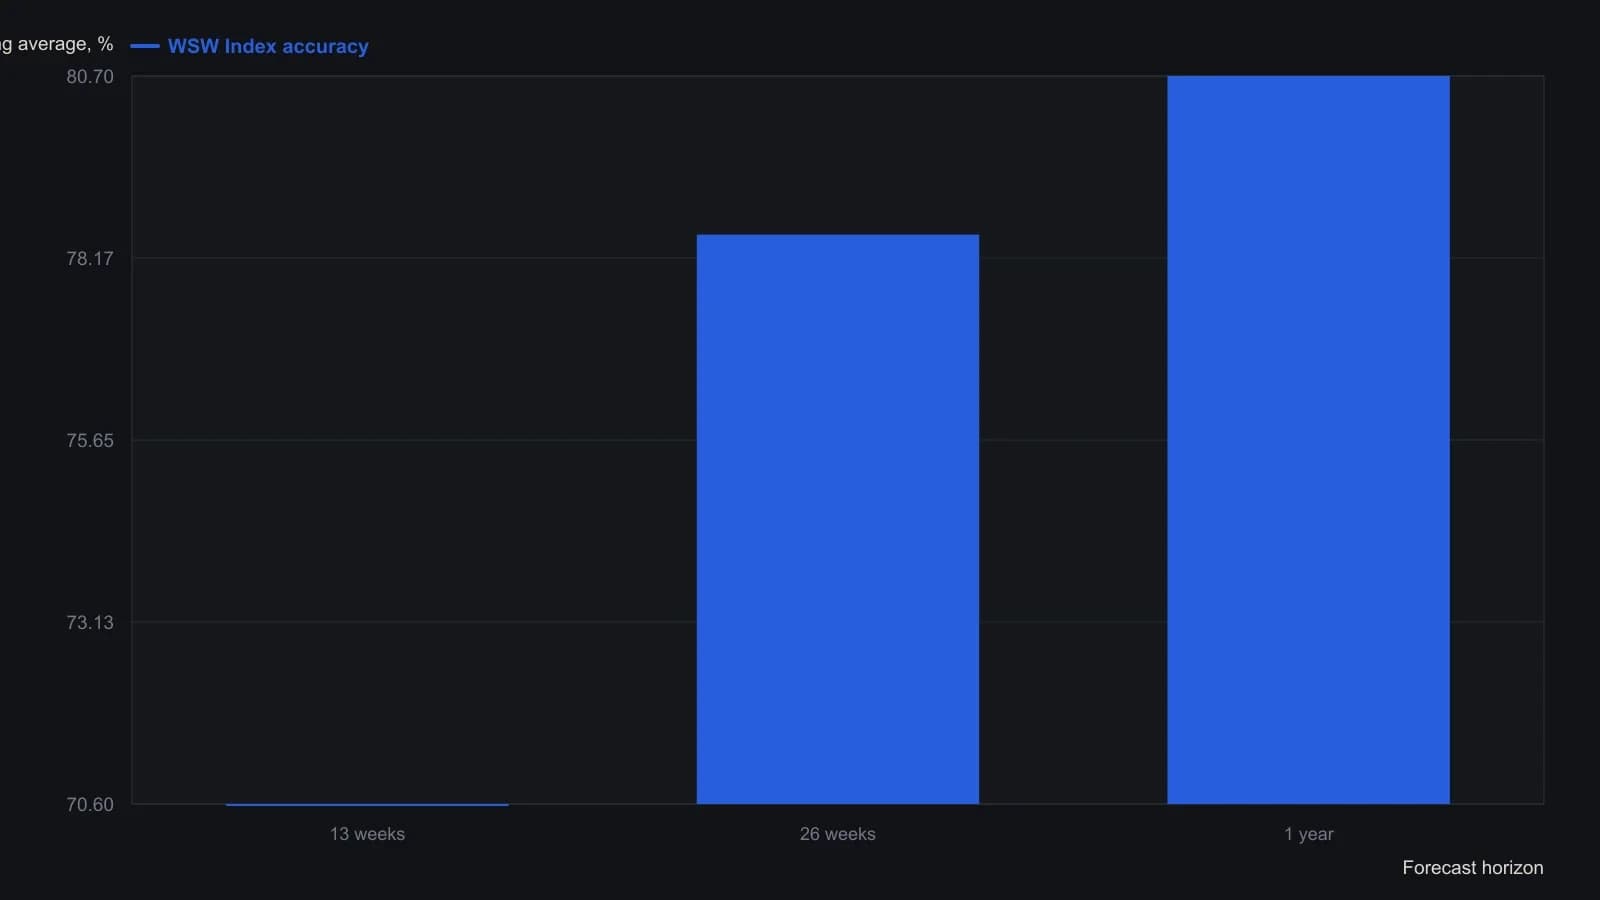
Each week the index was asked only whether it was bullish or bearish; a hit was the market’s direction over the next 13 weeks, 26 weeks, or one year. Merrill reports the 10-year record as highly significant on a chi-square test.
All readings on this track · 20 readings
- 1986A pre-trade checklist for crowded trading methods
- 1988Contrary decision process versus lagging bullish consensus
- 1988Constructing contrarian signals from polled consensus
- 1989Constructing a ten-input breadth diffusion score
- 1989Even-number first penetration as a construction problem
- 1991Joint strength and sentiment rules for entries and exits
- 1995Evaluating contrarian sentiment thresholds for bond futures
- 1998A weekly composite-score that classifies despair, euphoria, or neither
- 1998Lagged phase clocks for market cycles
- 2003Process rules when a correct view fails
- 2003Closing stops and equity-curve filters as one decision process
- 2003One procedure for entry, exit, and standing aside
- 2004Cross-index volatility gauges as a premium regime map
- 2005When trend rules need a losing filter
- 2006Evaluating sector breadth as a contrarian regime filter
- 2011Sideline patience versus crowd noise
- 2012Assembling a sentiment zone oscillator as one contrarian filter
- 2012Currency regime context for fading rallies
- 2014When late trend confirmation is a sideline signal
- 2017Write a daily contrarian rule from the closed-end-fund discount