2006issue C081-4
Evaluating sector breadth as a contrarian regime filter
Lock one moving-average rule on a fixed sector list, treat the daily weakness count as a market-state label, and test whether contrarian extremes and quiet mid-range states mark different later index environments before any entry rule is written.
- Define the daily sentiment-count as how many names in a fixed list of fifteen sector funds close below their own 25-day moving averages, so the reading is always an integer from zero to fifteen.
- Treat that integer as a market-regime label built from sector-breadth, not as an entry trigger, so one later trade can be read against a broader backdrop.
- In the historical sample the typical count clustered near seven, readings of fourteen or more were uncommon, and the link from the count to the next 30 trading days in a broad equity index was nonlinear and U-shaped.
- High counts were framed as a contrarian-strategy state associated with pessimistic positioning, not as a trend-following rule that waits for prices to strengthen first.
A fixed sector count
A mechanical sentiment reading can be defined as the count of a fixed list of fifteen sector funds that sit below their own 25-day moving averages, so the reading is always an integer from zero to fifteen. The moving-average is a fixed-lookback average of recent prices used to mark each sector series as currently weak or not. The daily integer is the sentiment-count: how many names in that fixed sector list close below their own moving averages.
Market-regime-classification groups the market by how many sectors sit below a shared moving-average line so one trade can be read against a broader backdrop. Because the list and the lookback stay fixed, the trigger does not change from day to day.
The count was offered as a systematic, spreadsheet-ready alternative to survey or cash-level sentiment tools that lack a fixed trigger and often mix stated opinion with actual positioning.
How later index outcomes were compared
Daily readings were evaluated from December 1998 through April 2006 by comparing each count with the following 30 trading days in a broad equity index. Forward index outcomes were measured from the close of the next business day after a reading, and the tabulated figures omitted dividends and trading costs.
In that sample the typical count clustered near seven, while readings of fourteen or more funds below their averages were uncommon.
A nonlinear, U-shaped link
The mapped link between the daily count and subsequent 30-day index outcomes was nonlinear and U-shaped: both very few and very many weak sectors sat in a different average follow-through region than the muted middle readings. That u-shaped-mapping is a historical pattern in which subsequent index outcomes differ at both extremes of a breadth count and in the muted middle range.
Forward S&P 500 return by sector-weakness count
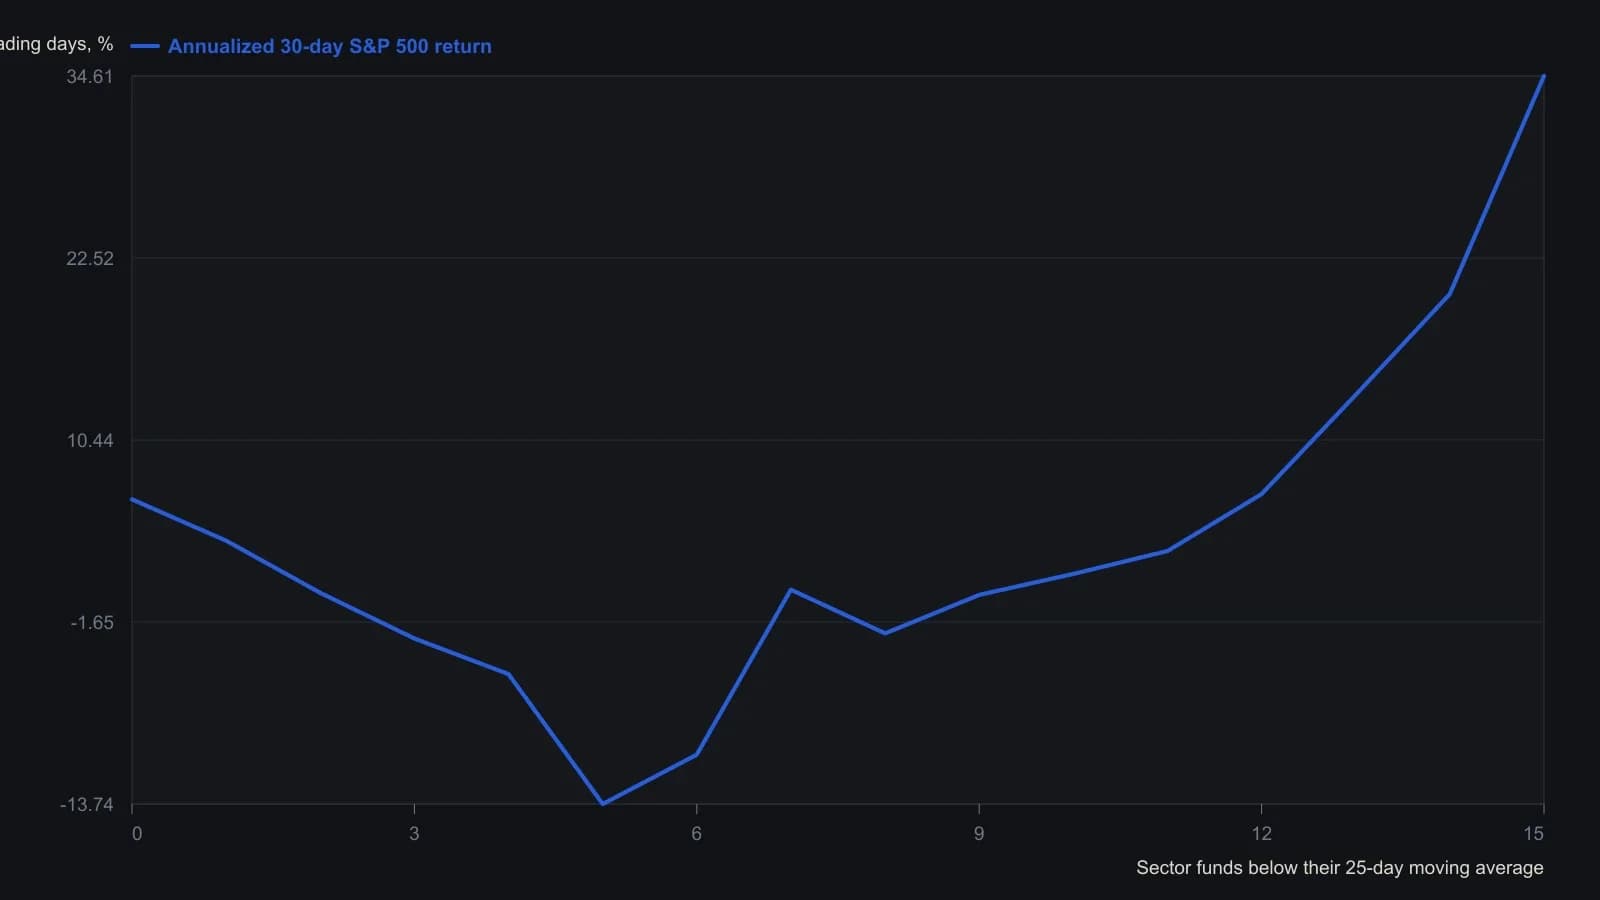
Each average assumes the S&P 500 is bought on the close of the next business day after the count is observed and omits dividends and commissions. The unconditional mean 30-day S&P 500 return over a slightly shorter window (through April 2005) was 0.22 percent.
Why a sector list
Sector-breadth is the cross-section of sector strength or weakness used as a proxy for how uniformly investors are being rewarded or punished. Sector funds were used instead of a single broad index so the classifier could separate widespread weakness from cases in which some parts of the market remained resilient.
Crowded weakness as a testable state
A contrarian-strategy is a mechanical stance that treats crowded weakness or crowded strength as the states worth testing, rather than chasing the prevailing trend. High counts of sectors below their averages were framed as a contrarian regime associated with pessimistic positioning, not as a trend-following rule that waits for prices to strengthen first.
Editorial: evaluate regimes before entries
TradersWeek's editorial view is that the useful habit is regime-first. Lock one moving-average rule on the fixed sector list, treat the resulting sentiment-count as a market-state label, and test whether contrarian extremes and quiet mid-range states mark different subsequent index environments. Only after that map is inspected would a later contrarian-strategy rule have distinct states to act on.
That reading is editorial. The archive described the historical workflow. It did not write an entry, exit or abstention procedure, and it should not be treated as a finished system.
All readings on this track · 20 readings
- 1986A pre-trade checklist for crowded trading methods
- 1988Contrary decision process versus lagging bullish consensus
- 1988Constructing contrarian signals from polled consensus
- 1989Constructing a ten-input breadth diffusion score
- 1989Even-number first penetration as a construction problem
- 1991Joint strength and sentiment rules for entries and exits
- 1995Evaluating contrarian sentiment thresholds for bond futures
- 1998A weekly composite-score that classifies despair, euphoria, or neither
- 1998Lagged phase clocks for market cycles
- 2003Process rules when a correct view fails
- 2003Closing stops and equity-curve filters as one decision process
- 2003One procedure for entry, exit, and standing aside
- 2004Cross-index volatility gauges as a premium regime map
- 2005When trend rules need a losing filter
- 2006Evaluating sector breadth as a contrarian regime filter
- 2011Sideline patience versus crowd noise
- 2012Assembling a sentiment zone oscillator as one contrarian filter
- 2012Currency regime context for fading rallies
- 2014When late trend confirmation is a sideline signal
- 2017Write a daily contrarian rule from the closed-end-fund discount