2006issue C071-6
Rounded-bottom screens, first-try breakouts, and Fibonacci retracements
A rounded-bottom is a U-shaped structure found by eye, so the archive used a short prefilter-screen for a recent 52-week high and a volume increase before any chart review. The breakout was treated as a first-try event. When that thrust stalled, the unwind was a fast Fibonacci-retracement rather than a gentle retest.
- A rounded-bottom is a visual U-shaped structure, not a field a screener can query, so a short prefilter-screen has to come first.
- The documented workaround screened for a recent 52-week high and a volume increase, then inspected the remaining charts for a bowl or other bullish structure.
- These bowls were described as often completing with a first-try breakout at 52-week highs after volume-confirmation.
- When the advance stalled, the expected unwind was a fast Fibonacci-retracement near one-third to 50 percent of the prior move, managed with a tightened trailing-stop.
A pattern a screener cannot query
A rounded-bottom, or bowl, is treated as a visual U-shaped structure identified by eye on a chart. It is not a field a screener can query directly, so any search has to work around that limit.
The documented workaround was to screen first for a recent 52-week high and a volume increase, then inspect the remaining charts for a bowl or other bullish structure. That shorter list is the prefilter-screen: a compact set of quantitative conditions used to shrink the charts that still have to be judged by eye.
How a short list still left charts to inspect
Adding more than about 10 absolute screen conditions produced an empty result. A shorter set of price, 52-week-high, ownership, volume, and growth filters then returned 16 names.
Among those 16 charts, one energy name was preferred because volume-confirmation supported the bowl. A higher open the next session was treated as breakout confirmation: a move through a prior extreme, often a 52-week high, counted only after volume expansion and follow-through.
In a review of the prior year's ten largest winners, seven were said to have formed a bowl that completed with a breakout at 52-week highs. Several case charts showed the same completion into a 52-week high on expanded volume, often after a company-specific news or earnings event.
Bowl Breakouts portfolio versus the stock universe
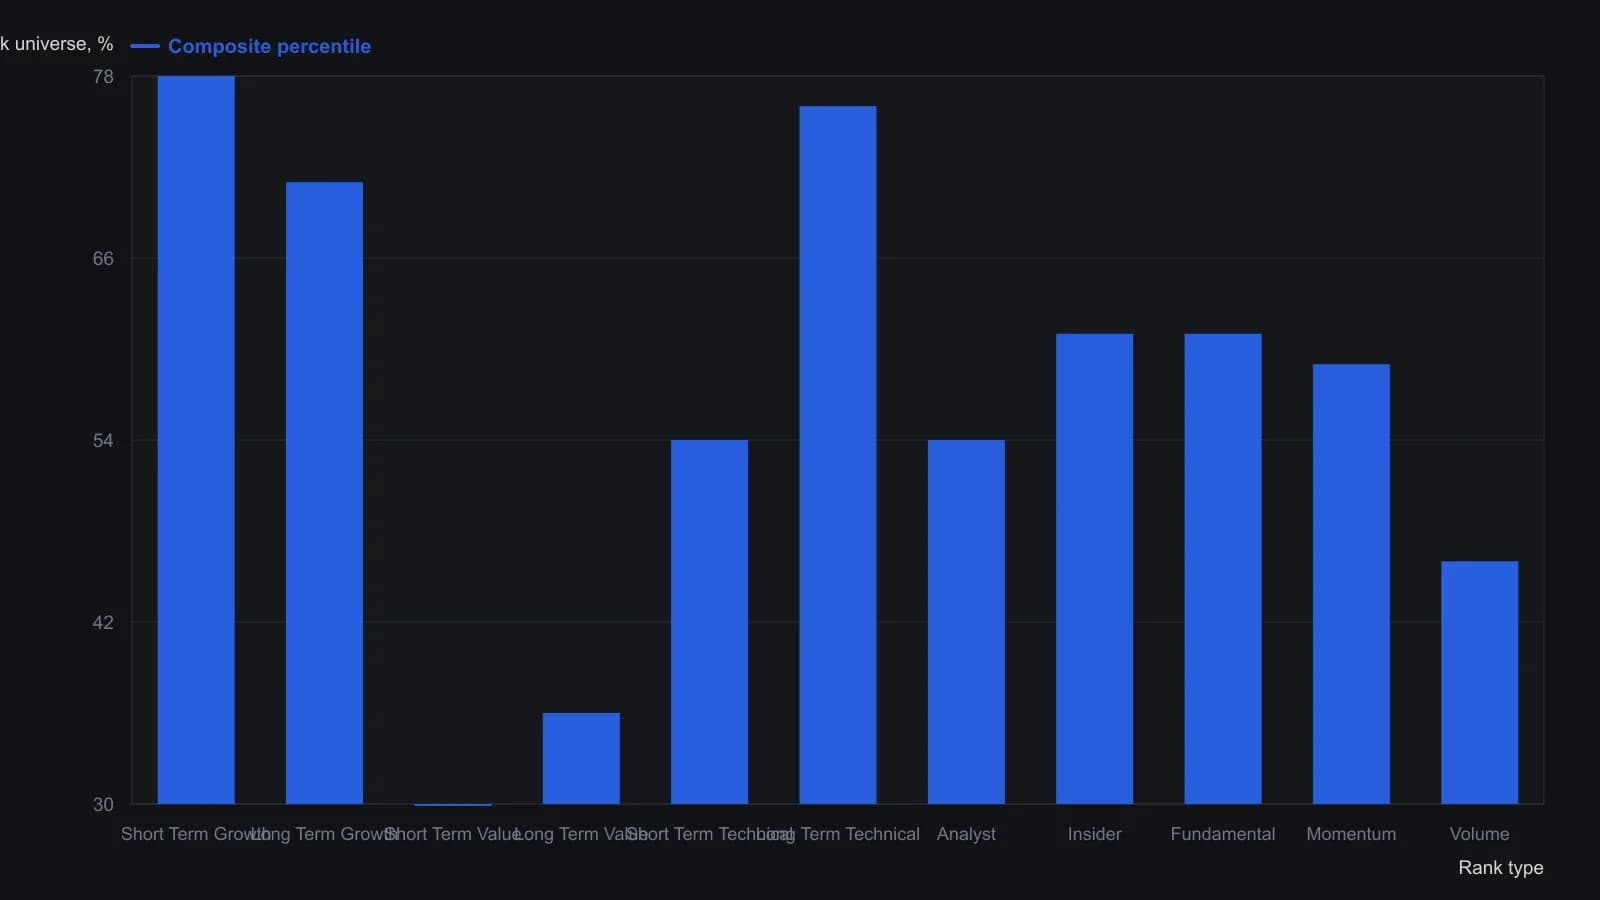
Each percentile compares that rank type with the full stock universe. The source marked the upper half green and the lower half red.
A first-try breakout, then exhaustion
The bowl is contrasted with patterns that may test a ceiling more than once. It is described as often breaking out on the first attempt and then advancing until momentum is exhausted.
Editorial reading: once the prefilter-screen has isolated a recent high and a volume increase, the rounded-bottom is no longer an untestable sketch. The first clearance of that high is the hypothesis. A later gentle retest is not the base case in this workflow.
When the thrust stalls
After the advance stalled short of a pre-set upside objective, a 3 percent trailing-stop was tightened on the decline. The first drop was described as more than 10 percent in as many days. A trailing-stop here is an exit that ratchets with price and is tightened once a rounded-bottom advance starts to reverse.
These breakouts, often in volatile micro-cap names, are described as able to reverse quickly near a one-third to 50 percent Fibonacci-retracement, especially where that zone already matches support or resistance. In this archive that pullback is the expected unwind after a first-try rounded-bottom thrust, not a second chance to prove the ceiling.
All readings on this track · 14 readings
- 1990Constructing falsifiable reversal patterns from price structure
- 1995Cup-with-handle construction: confirm the cup, the handle, then the breakout
- 1995Cup-completion cheat before the handle breakout
- 1998Constructing rounded-bottom cups as testable entries
- 1999Rounded bottom landmarks, invalidation, and breakout rules
- 2003Constructing rounded bottoms, triangles, and pennants
- 2006A five-by-five grid that accepts or rejects a cup
- 2006NTRI and the 2005 bowl breakout case
- 2006Rounded-bottom screens, first-try breakouts, and Fibonacci retracements
- 2007Constructing rounded bottoms as multi-year bases
- 2011Early semi-cup construction from the left rim and base
- 2011Early rounded bottom recognition on a locked log-price grid
- 2013Rounded turns as slope-first trade hypotheses
- 2017Evaluating a rounded bottom as a testable payoff structure