1995issue C031-5
Cup-with-handle construction: confirm the cup, the handle, then the breakout
A cup with handle is assembled in a fixed order. First confirm a rounded, time-and-depth-disciplined cup. Then require a descending handle on light volume. Then demand a volume-confirmed breakout through the handle and prior highs. Editorial use of that historical workflow is to reject a lookalike at the first failed step.
- Confirm the cup first: a multi-week rounded-bottom whose left side corrects a prior advance, whose lows form on light selling, and whose right side rebuilds toward prior highs rather than a sharp V reversal.
- Require a handle that lasts more than one or two weeks, sits in the upper half of the cup (preferably the upper third), and drifts lower on very light volume beneath overhead-resistance.
- Read volume-price-analysis at every stage: dry-up at the lows and in the handle, accumulation on the right-side advance, and a breakout surge of about 40% above fifty-day-average-volume.
- Reject failure-prone builds before treating a breakout as a signal: excessive cup-depth, a handle in the lower half or below the 200-day moving average, adverse volume, an upward drift, or a short, overly deep V-shaped cup.
Read construction as a rejectable sequence
Editorial note: TradersWeek treats cup-with-handle construction as a rejectable sequence. The historical workflow describes what a finished cup, handle, and breakout look like. The editorial use of that workflow is to fail a lookalike at the first missing step, before the picture is treated as a trade hypothesis.
The order is fixed. Confirm the rounded-bottom cup first. Require a constructive handle second. Demand a volume-confirmed breakout last. Volume-price-analysis runs through every step as the demand-and-supply test, not as a separate overlay added after the picture is already accepted.
Confirm the rounded cup first
The cup is the rounded-bottom of the pattern: a multi-week rounded price trough. Its left side is a downtrend that corrects a prior advance. Price then bottoms, and the right side advances back toward the old highs rather than reversing in a sharp V.
A cup typically lasts three to six months. The historical workflow also describes a wider range, from about seven weeks in strong markets to as long as 12 months in weak markets.
Cup-depth is the percentage decline from the left-side high to the cup low. It is used to judge whether the base is constructive or excessively deep. Many cups are 12-20% deep and can reach 35-40% after market corrections. Depths above 45% outside a bear market are described as too excessive. A 21-35% depth is expected to last about 13 to 26 weeks if the trough is to keep a rounded shape.
More constructive cups tend to form near the start of a new bull market or during intermediate corrections. Failure-prone versions more often appear late in a bull cycle.
FSI International: rounded cup, handle, and August breakout
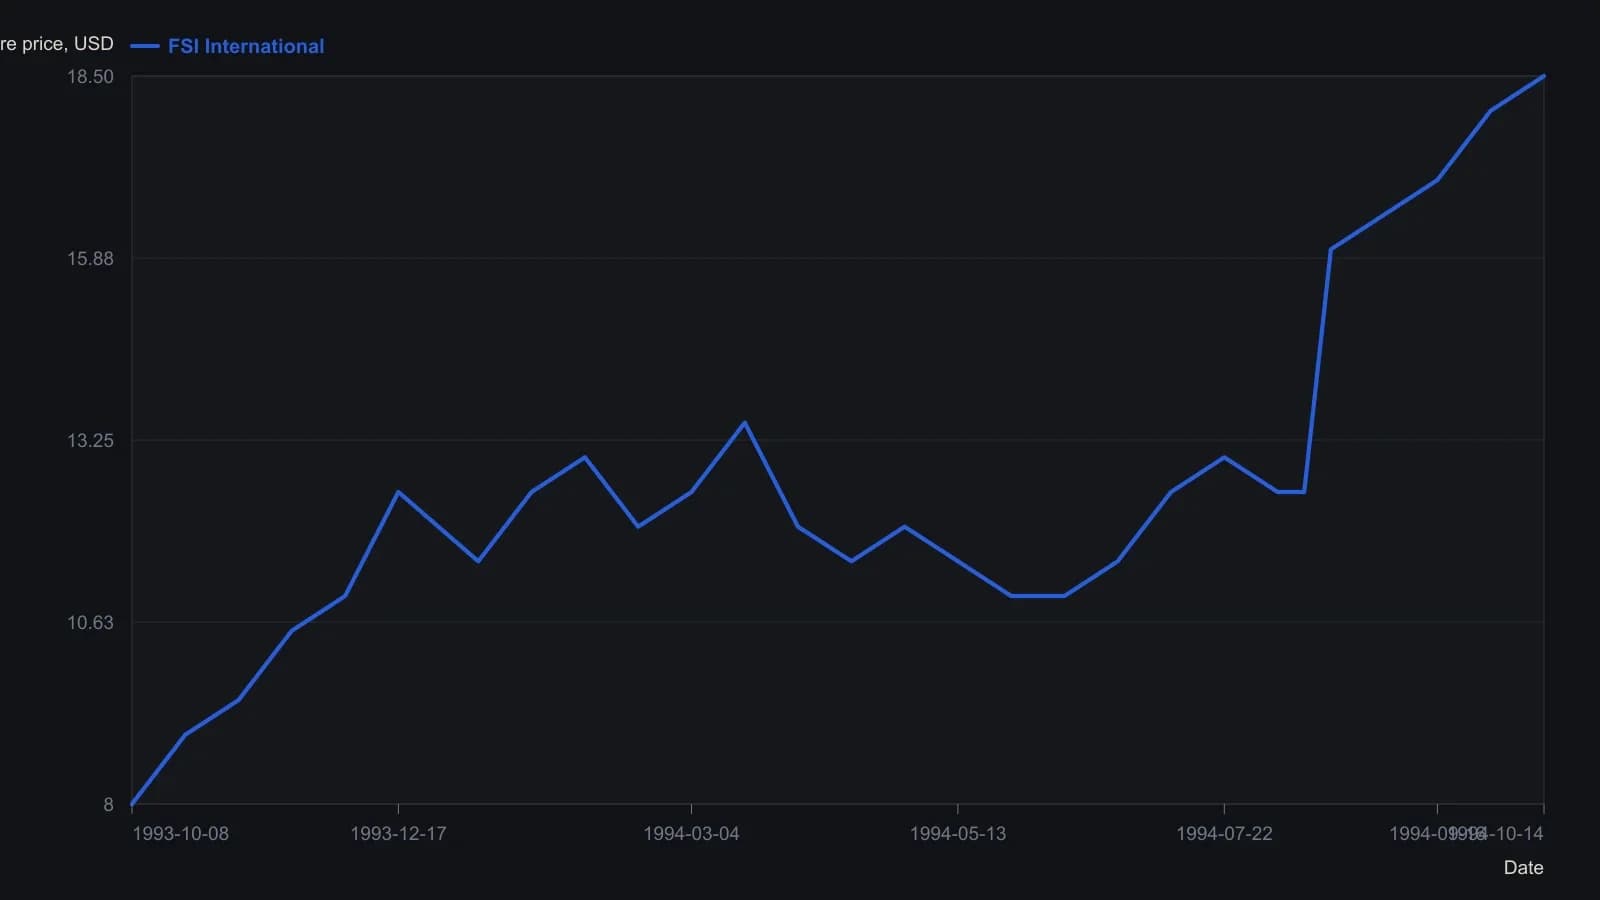
Approximate weekly readings from a dense daily-bar raster; half-dollar precision is the finest the print will support. Volume bars are visible but unlabeled, so volume is not plotted. The article also describes a mid-March failure above 15 that the daily cloud does not resolve as a single clean print.
Require a descending handle under overhead resistance
Selling near the cup's original highs creates overhead-resistance. That supply, from earlier buyers and late profit-takers, should stall the right-side rise and lead into a handle consolidation.
The handle is a short consolidation after the cup's right side stalls at old highs. A constructive handle lasts more than one or two weeks, forms in the upper half of the cup, preferably the upper third, and drifts lower on very light volume. A handle that is still missing, still rising, or already sliding into the lower half of the cup fails this step.
Test demand and supply with volume
Volume-price-analysis reads volume as the demand-and-supply test of the pattern. Light volume at cup lows and in the handle is treated as a lack of sellers. The right-side advance and the breakout should show rising or surging volume as evidence of demand.
In the historical workflow, a handle breakout needs volume to surge about 40% above fifty-day-average-volume to confirm that demand is present at the earliest new-high point.
Treat a breakout as a signal only after a volume surge
A breakout is a move through the handle and prior-high resistance after the cup is complete. It is treated as a signal only when that advance is accompanied by a decisive volume surge. The surge is the earliest evidence that demand is present at the new-high point, not merely that price has printed above a line.
Editorial note: without the volume test, a cross of the handle is only a price event. The historical workflow does not treat that event, by itself, as a completed construction.
What fails the construction test
Failure-prone construction includes excessive adverse volume, a handle that falls into the lower half of the cup or entirely below the 200-day moving average, an erratic look, a handle that drifts up, or a short, overly deep V-shaped cup.
Editorial note: if any of those faults is present, the assembly is incomplete. The historical description does not ask a trader to repair a deep V, an upward-drifting handle, or a late-cycle, excessively deep base by waiting for a prettier breakout. The rejection is the point of the checklist.
All readings on this track · 14 readings
- 1990Constructing falsifiable reversal patterns from price structure
- 1995Cup-with-handle construction: confirm the cup, the handle, then the breakout
- 1995Cup-completion cheat before the handle breakout
- 1998Constructing rounded-bottom cups as testable entries
- 1999Rounded bottom landmarks, invalidation, and breakout rules
- 2003Constructing rounded bottoms, triangles, and pennants
- 2006A five-by-five grid that accepts or rejects a cup
- 2006NTRI and the 2005 bowl breakout case
- 2006Rounded-bottom screens, first-try breakouts, and Fibonacci retracements
- 2007Constructing rounded bottoms as multi-year bases
- 2011Early semi-cup construction from the left rim and base
- 2011Early rounded bottom recognition on a locked log-price grid
- 2013Rounded turns as slope-first trade hypotheses
- 2017Evaluating a rounded bottom as a testable payoff structure