2015issue C0249
Price the win, stall, and loss before a stock entry
Before a stock entry, turn session facts into if-then branches, then treat a familiar risk-reward sketch as unfinished until the win, stall, and loss paths are probability-weighted into expected value.
- Frame the strategy as if-then rules for instrument type, market conditions, and trade qualifiers, and account for both win potential and loss magnitude.
- Expected value is win probability times win amount minus loss probability times loss amount, and it is the trade expectation rather than the hoped-for profit.
- A probability cannot be assigned from the setup alone. The path of the stock and the state of the market, sector, and industry group, plus variance and volatility, are required inputs.
- Support-and-resistance risk-reward ratios are progress toward considering loss size, but expected value is the step that improves on a standardized risk-reward ratio.
Frame the strategy as if-then rules
A strategy is framed as if-then rules for instrument type, market conditions, and trade qualifiers. An if-then rule is a written condition that authorizes a long or short action only after a stated price or context fact is observed. The same framing must account for both win potential and loss magnitude.
Build the decision tree from session facts
A decision tree is an ordered set of price, range, and context observations that generate the if-then branches for a single-stock or hedged setup. Inputs listed for those rules include the prior close, prior high and low, five-, ten-, or twenty-day highs and lows, pivot and projected levels, the current session open, high, and low, and a percentage of average true range.
Example branches cover a gap-fill toward the prior close, a staircase of higher opens and closes judged against a pivot and a 35 percent average true range band, and a retest of a twenty-day high or low after a breakout or breakdown. An average true range band is a volatility-scaled distance from a pivot or reference level used to locate an entry zone rather than a fixed price offset.
Grade how the loss is treated
Three graded approaches are contrasted. The first is entering with no loss plan. The second is placing a stop 0.50 from entry. The third is assigning probabilities to a gain, a sideways outcome, and a decline before computing expected value.
Expected value is defined as win probability times win amount minus loss probability times loss amount. It is presented as the trade expectation rather than the hoped-for profit.
Weight win, stall, and loss into expected value
In the worked long example, a 50 percent chance of a 1.00 gain, a 20 percent chance of no movement, and a 30 percent chance of a 0.50 decline produce an expected value of 0.35. That figure is treated as a positive expectation rather than the original 1.00 target.
A probability cannot be assigned from the setup alone. The path of the stock and the state of the market, sector, and industry group, plus variance and volatility, are required inputs.
Probability-weighted paths for a $1 long setup
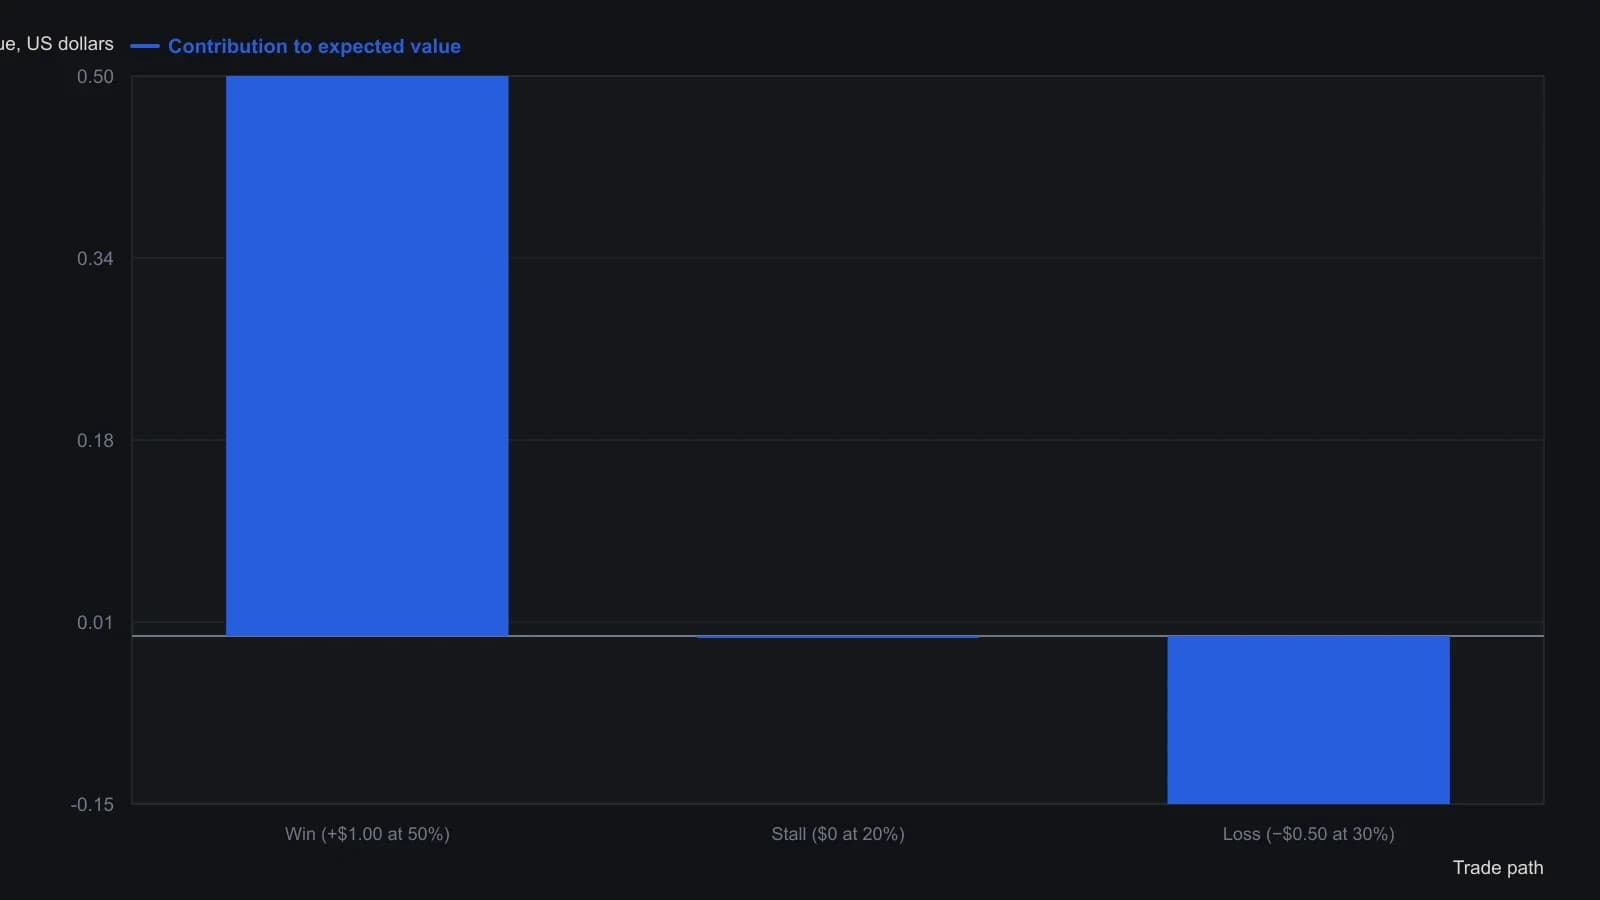
The source treats the stall path as a zero-dollar outcome. The $0.35 EV equals 0.50×1.00 + 0.20×0.00 − 0.30×0.50.
Use expected value after the risk-reward ratio
Support-and-resistance risk-reward ratios are progress toward considering loss size. A risk-reward ratio is a static comparison of planned profit distance to planned loss distance off a level, and it is treated as incomplete until probabilities are attached. Expected value is presented as the step that improves on a standardized risk-reward ratio.
All readings on this track · 22 readings
- 1995A pre-trade checklist that bounds loss before the order
- 1998Ledger audit of exits, payoff, and overlap
- 1998A return-to-loss filter for drawdown-aware evaluation
- 2000Pair historical volatility with return-to-loss filters
- 2001Credit-spread construction that can fail before any order is sent
- 2002Evaluating mechanical systems in a traders market
- 2002Profitability as a bound implied by RWL and commission
- 2004A day-trading breakeven matrix for size and win rate
- 2006Sit out, size and expectancy as one procedure
- 2006A testable intraday procedure from setup to stand-down
- 2007A planned liquidity offer at the inflection point
- 2011A style-neutral expectancy filter for system evaluation
- 2011Separate buying power from posted risk capital
- 2012Design before you trade: testing mechanical systems
- 2014Ideal trader hindsight as a pretrade filter
- 2014When expectancy and drawdown limits disagree
- 2015Signal, confirm, and invalidate before the trade
- 2015Price the win, stall, and loss before a stock entry
- 2016Construct expectancy by bounding losses and winner size
- 2017Estimate expectancy before you accept the trade
- 2017Size ladder tests for drawdown caps and expected value
- 2017Evaluate a high-yield correlation break as one locked procedure