1998issue C081-4
Ledger audit of exits, payoff, and overlap
A weekly fill audit can grade a book as a procedure: whether entry, exit, and sitting out are one testable rule set, whether a loss or exposure bound is fixed before the order, and whether the book is a distinct bet or only an echo of correlated desks.
- A fill-level archive of instrument, buy or sell, initiation versus close, price, and context such as sector or volatility can be summarized into holding time, profitable-close rate, and payoff by execution path.
- The same archive can flag too many names, scalping, exiting too fast or too slow, and losses larger than the stated rule set.
- Stronger books in the reviewed sample often had winning-close rates only in the 50-55% band, with evaluation placed on extracting at least about twice as much on winners as was given back on losers.
- Books with negative or statistically weak revenue correlation were treated as less redundant, while positively correlated weaker books were candidates for capital redeployment.
Grade the procedure, not the persona
Editorial: grade the fill ledger as a procedure, not as a persona. A weekly audit is useful when it asks three questions together. Are entry, exit, and sitting out one testable rule set? Is a loss or exposure bound fixed before the order? Is the book a distinct bet, or only an echo of correlated desks?
Trading-psychology-process, as used here, means using a transaction archive to make habits of entry, exit, and abstention visible so coaching targets a repeatable procedure rather than a personality label. The reviewed program treated risk-desk statistics as inputs to a behavior-change loop, not only as a capital report.
What a fill archive can summarize
A fill-level archive that records instrument, buy or sell, initiation versus close, price, and added context such as sector or volatility can be summarized into holding time, profitable-close rate, and payoff by execution path.
The same archive used to review risk can also flag behavioral patterns such as too many names, scalping, exiting too fast or too slow, and losses larger than the stated rule set.
Payoff shape in three reviewed books
One reviewed short-hold book averaged a quarter-day hold, with mean gain per share 0.35 versus mean loss 0.33 and a position-management-ratio of 1.06, a profile consistent with cutting winners almost as tightly as losers. After that short-hold pattern was shown in the numbers, the coaching plan was to lengthen the usual hold, described as at least doubling it, and to reduce the pressure to flatten immediately.
A second reviewed book in an early-1998 window showed a 1.40 win-to-loss ratio, a 0.46-day average hold, and a 54.8% profitable-close rate, which is the security-selection-ratio for that book. A later cut of the same window showed average gain 0.23 versus average loss 0.20 per share.
A third reviewed book showed a 2.37 win-to-loss ratio, with mean gain 1.94 versus mean loss 0.82 per share, together with a negative link between profitability and hold time of -23.8% on trades and -21.7% on shares, and average duration of 3.32 days per trade.
In the reviewed sample, stronger books often showed winning-close rates only in the 50-55% band, with evaluation placed on extracting at least about twice as much on winners as was given back on losers.
Win-to-loss ratios of three reviewed traders
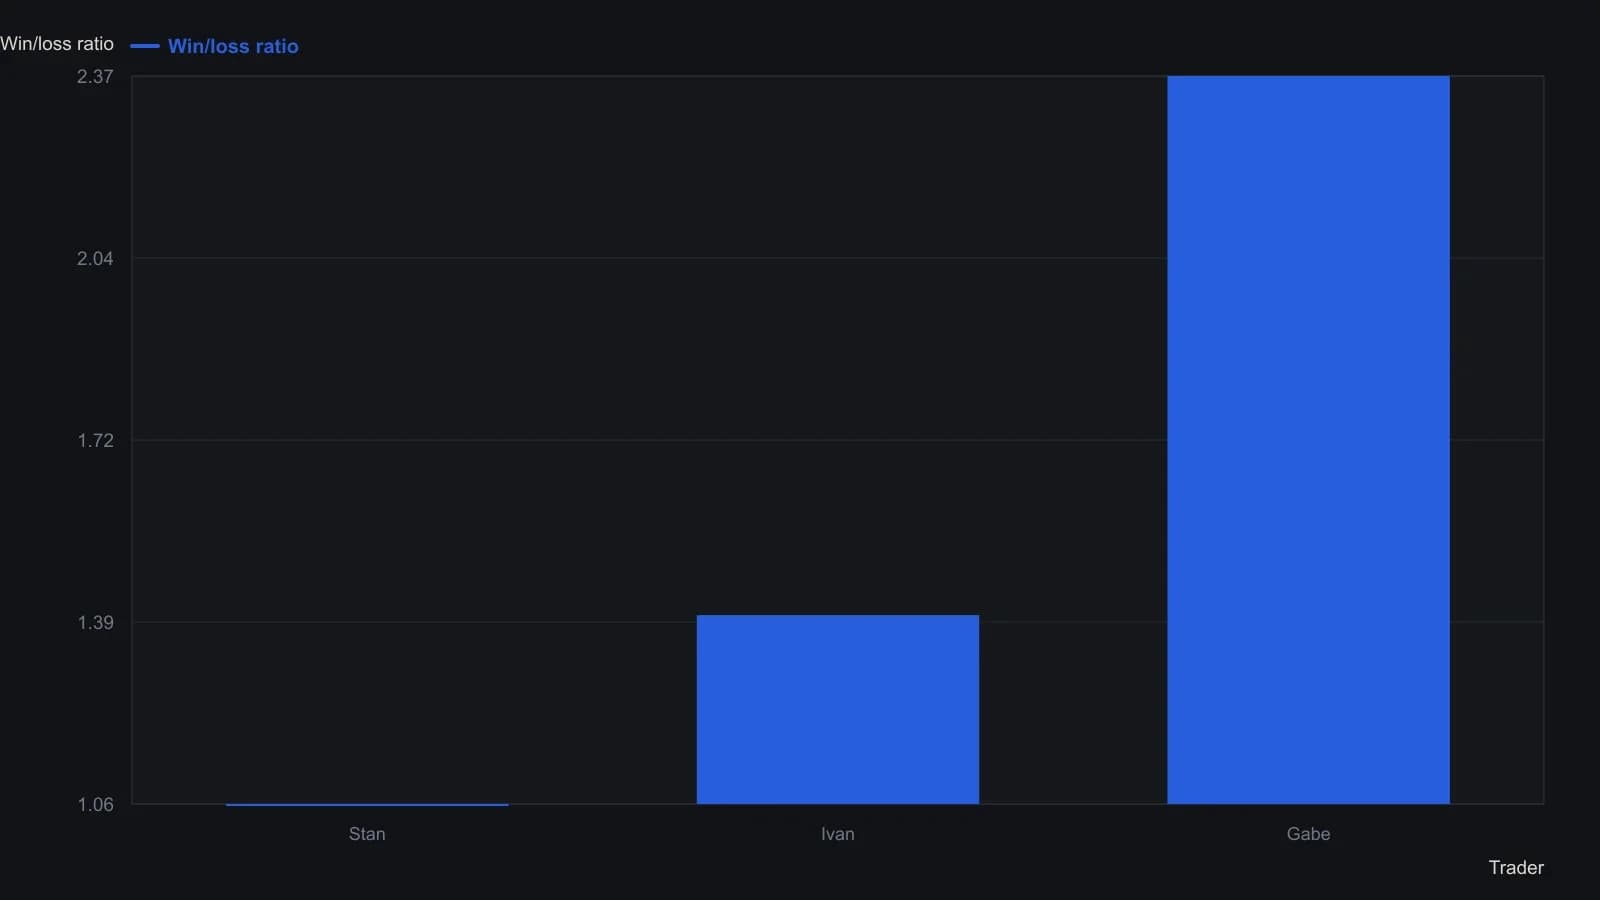
Sample windows are not shared: Stan is described over about one year, Ivan over first-quarter 1998, and Gabe’s window is not dated. The bars compare stated payoff shape, not a common period.
Overlap, concentration, and capital
Across the reviewed desk, about 3% of transactions were said to account for all net profitability, about 97% were breakeven at best, and the top tenth of trades produced cumulative profit and loss nearly double the firm total.
Desk construction used cross-trader revenue correlation. Books with negative or statistically weak correlation were treated as less redundant, while positively correlated weaker books were candidates for capital redeployment.
Editorial: correlation-analysis, as used here, means measuring whether two books, or a book and its own hold time, move together so capital is not stacked on redundant or duration-mismatched risk.
All readings on this track · 22 readings
- 1995A pre-trade checklist that bounds loss before the order
- 1998Ledger audit of exits, payoff, and overlap
- 1998A return-to-loss filter for drawdown-aware evaluation
- 2000Pair historical volatility with return-to-loss filters
- 2001Credit-spread construction that can fail before any order is sent
- 2002Evaluating mechanical systems in a traders market
- 2002Profitability as a bound implied by RWL and commission
- 2004A day-trading breakeven matrix for size and win rate
- 2006Sit out, size and expectancy as one procedure
- 2006A testable intraday procedure from setup to stand-down
- 2007A planned liquidity offer at the inflection point
- 2011A style-neutral expectancy filter for system evaluation
- 2011Separate buying power from posted risk capital
- 2012Design before you trade: testing mechanical systems
- 2014Ideal trader hindsight as a pretrade filter
- 2014When expectancy and drawdown limits disagree
- 2015Signal, confirm, and invalidate before the trade
- 2015Price the win, stall, and loss before a stock entry
- 2016Construct expectancy by bounding losses and winner size
- 2017Estimate expectancy before you accept the trade
- 2017Size ladder tests for drawdown caps and expected value
- 2017Evaluate a high-yield correlation break as one locked procedure