2011issue C0342-44
A style-neutral expectancy filter for system evaluation
A single expectancy score compares unlike trading methods by combining win-rate with reward-risk. The same score can bound exposure before entry. Robustness-testing remains a separate check on whether that historical profile may be used as a live rule.
- A single expectancy score can compare methods that differ in style, holding period, and payoff shape because it combines win frequency with average payoff size.
- Distinct pairings of win-rate and risk-reward-ratio can sit on the same breakeven-contour, so neither statistic alone ranks a method.
- Once a success probability, stop, and target are stated, the same calculation works as a pre-trade-filter that bounds the exposure decision before entry.
- A historical expectancy score is backward-looking and should be paired with robustness-testing before it is treated as a live rule.
A single score across unlike methods
A single expectancy score can compare trading methods that differ in style, holding period, and payoff shape because it combines win frequency with average payoff size. Expected-value is the filter form of that score: it is formed from win-rate and reward-risk and states how far a method sits from breakeven so unlike systems can be compared on one scale.
How the filter is formed
Expectancy is formed by multiplying the win percentage by the reward-risk ratio and then subtracting the complementary loss percentage. Distinct pairings of win-rate and risk-reward-ratio can all sit on a zero-expectancy boundary, so neither statistic alone ranks a method. That boundary is the breakeven-contour, the set of win-rate and reward-risk pairings that produce a zero expectancy score.
Reading the score from a completed list
On a completed trade list, risk-reward-ratio can be measured as average winning result divided by average losing result after win-rate is counted from the same list. Win-rate is winning trades as a share of all trades in the sample used to compute expectancy. When stake size is part of the method, currency averages may be used. When the goal is to isolate the rule itself, entry-to-exit percentage change avoids distortion from unusually large or small bets.
A trade list used for expectancy should contain at least thirty observations before the sample is treated as statistically meaningful. A moving average of expectancy, illustrated as a thirty-observation window, can track the method over time independently of the equity curve.
The same calculation before entry
The same expectancy calculation can be run before entry once a success probability, stop distance, and target are stated, so the exposure decision is bounded before the trade is placed. That use is a pre-trade-filter: running expectancy after a success probability, stop, and target are stated so the loss is bounded before entry. In this use, risk-reward-ratio is planned target versus planned stop, used as an input that bounds the payoff side of the expectancy filter.
A map of profit, loss, and breakeven
Plotting win-rate against reward-risk maps methods into a profit zone, a loss zone, and a breakeven-contour, which makes distance from zero expectancy visible across unlike approaches.
Profit and loss zones in win-rate versus reward/risk space
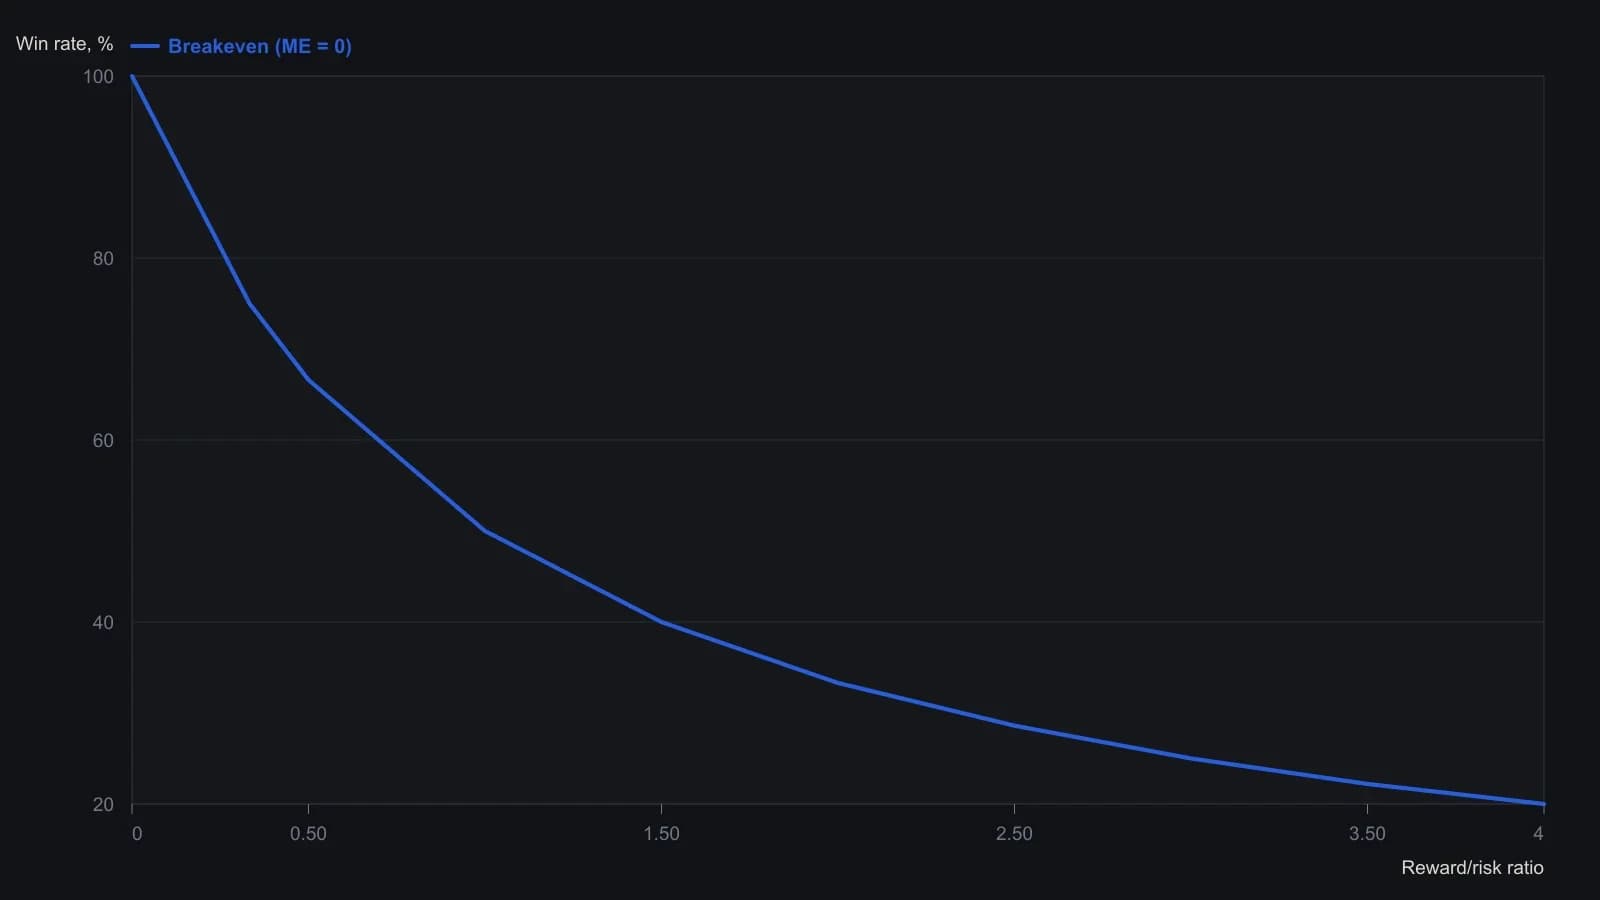
Zero expectancy means Win% × R/R − (100 − Win%) = 0, with win rate entered in percentage points as in the worked examples. The printed breakeven rows are 75 percent at 1/3, 66.6 percent at 0.5, 50 percent at 1, and 33.3 percent at 2.
Robustness as a later gate
A historical expectancy score is backward-looking and does not by itself establish that a rule will keep working. It should be paired with robustness work such as forward tests and sensitivity checks plus a plan for when live results depart from the expected profile. Robustness-testing is those forward tests, input-sensitivity checks, and related procedures that ask whether a historical expectancy profile is stable enough to treat as a live rule.
All readings on this track · 22 readings
- 1995A pre-trade checklist that bounds loss before the order
- 1998Ledger audit of exits, payoff, and overlap
- 1998A return-to-loss filter for drawdown-aware evaluation
- 2000Pair historical volatility with return-to-loss filters
- 2001Credit-spread construction that can fail before any order is sent
- 2002Evaluating mechanical systems in a traders market
- 2002Profitability as a bound implied by RWL and commission
- 2004A day-trading breakeven matrix for size and win rate
- 2006Sit out, size and expectancy as one procedure
- 2006A testable intraday procedure from setup to stand-down
- 2007A planned liquidity offer at the inflection point
- 2011A style-neutral expectancy filter for system evaluation
- 2011Separate buying power from posted risk capital
- 2012Design before you trade: testing mechanical systems
- 2014Ideal trader hindsight as a pretrade filter
- 2014When expectancy and drawdown limits disagree
- 2015Signal, confirm, and invalidate before the trade
- 2015Price the win, stall, and loss before a stock entry
- 2016Construct expectancy by bounding losses and winner size
- 2017Estimate expectancy before you accept the trade
- 2017Size ladder tests for drawdown caps and expected value
- 2017Evaluate a high-yield correlation break as one locked procedure