1995issue C101-8
A pre-trade checklist that bounds loss before the order
A trading game plan can be written from the probability of being right, the gain when right, and the loss when wrong. The archive applies those three inputs as one procedure to every trade: refuse avoidable losing entries, limit planned loss, and skip setups whose expected loss is nearly as large as expected gain.
- A trading game plan can be written from three inputs: the probability of being right, the gain when right, and the loss when wrong.
- Expected value is applied to a future series of trades, not to a single already-open bet, and the same three-input procedure is used on every trade.
- Avoidable losing entries are refused before the order by rejecting whim orders, outside tips, black-box systems, and consensus figures the trader cannot interpret.
- Planned loss is limited to 1-2% of trading capital, thin risk-reward setups are skipped, and a history of average losses twice average gains is a reason to abandon or rebuild the method.
Three inputs become one procedure
A trading game plan can be written as a function of three variables: the probability of being right, the gain when right, and the loss when wrong. Probability of being right is the chance that price subsequently moves in the intended direction after the entry order is placed.
Trade outcomes remain uncertain until the position is closed, so the same expected-value expression is meant to govern a future series of trades rather than a single already-open bet. Expected value is the probability-weighted gain minus the probability-weighted loss, used as a go/no-go filter before the order is placed.
Because the chance of being wrong equals one minus the chance of being right, the plan reduces to those three inputs and can be applied as one procedure to every trade. A checklist process is a written pre-trade sequence that makes entry, exit and abstention the same testable procedure.
Refuse avoidable losing entries
The probability factor rises most sharply once the chance of being right is above 0.9, so the framework places a heavy premium on reducing avoidable losing entries. Losing trades are reduced before entry by refusing whim orders, outside tips, black-box systems, and consensus figures the trader cannot independently interpret.
A pre-trade confidence check requires studying the relevant price history, understanding any indicators used, and confirming with more than one method rather than buying an opaque package.
Limit the loss and skip thin payoffs
Before placing an order, planned loss on that trade is limited to 1-2% of trading capital, and setups whose expected loss is nearly as large as expected gain are skipped. The risk-reward ratio is the planned gain relative to the planned loss on one trade, used to reject setups whose payoff cannot cover the defined risk.
The trader waits for price to create room for gains, such as a retracement in a new uptrend, instead of forcing a risk level onto the market.
Gain factor versus size of the average winner
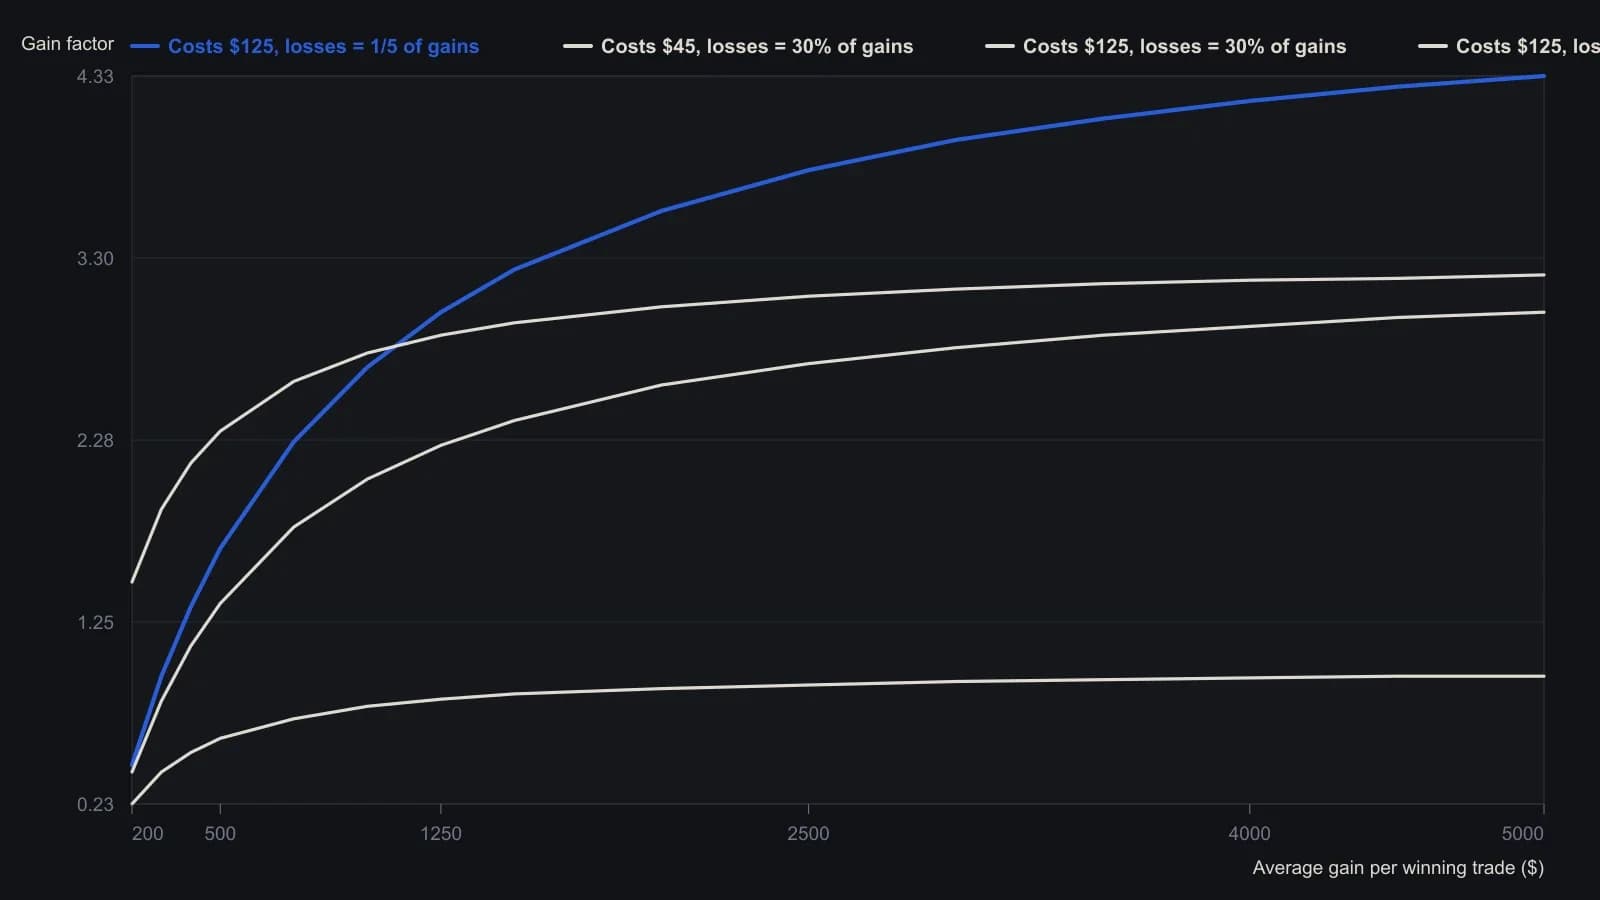
The printed figure also included a fifth curve with losses twice gains (the dump-the-system case), omitted because only four series are carried. Points start at a $200 average winner so the factor stays defined after costs.
Rebuild from history, then scale contracts
A history in which average losses are twice average gains is treated as a reason to abandon or rebuild the method. A more favorable gain-to-loss mix improves the gain factor even after costs. Editorial: TradersWeek reads that history-level gain-to-loss mix as a profit factor, meaning probability-weighted gains versus probability-weighted losses across a series of trades.
The plan as written assumes one contract per position, leaves stop placement and fund-optimization outside the formula, and treats contract count as a later multiple of the same bounded loss and gain figures.
All readings on this track · 22 readings
- 1995A pre-trade checklist that bounds loss before the order
- 1998Ledger audit of exits, payoff, and overlap
- 1998A return-to-loss filter for drawdown-aware evaluation
- 2000Pair historical volatility with return-to-loss filters
- 2001Credit-spread construction that can fail before any order is sent
- 2002Evaluating mechanical systems in a traders market
- 2002Profitability as a bound implied by RWL and commission
- 2004A day-trading breakeven matrix for size and win rate
- 2006Sit out, size and expectancy as one procedure
- 2006A testable intraday procedure from setup to stand-down
- 2007A planned liquidity offer at the inflection point
- 2011A style-neutral expectancy filter for system evaluation
- 2011Separate buying power from posted risk capital
- 2012Design before you trade: testing mechanical systems
- 2014Ideal trader hindsight as a pretrade filter
- 2014When expectancy and drawdown limits disagree
- 2015Signal, confirm, and invalidate before the trade
- 2015Price the win, stall, and loss before a stock entry
- 2016Construct expectancy by bounding losses and winner size
- 2017Estimate expectancy before you accept the trade
- 2017Size ladder tests for drawdown caps and expected value
- 2017Evaluate a high-yield correlation break as one locked procedure