2004issue C101-3
A day-trading breakeven matrix for size and win rate
Average expected profit per trade can be assembled from win rate, size, reward multiple, point value, initial risk, and round-trip commission. Those identities can sit in one spreadsheet that reports the breakeven win rate across reward multiples and trade counts while commission, size, and overhead stay fixed.
- Average expected profit per trade can be assembled from win rate, contracts or shares, reward multiple, point value, initial risk in points, and round-trip commission.
- Given a fixed reward multiple, a planned trade count, size, commission, and overhead, the identities solve for the breakeven win rate: the minimum share of winners that makes expected value times trade count equal overhead.
- One spreadsheet can report that floor across reward multiples and trade counts while commission, size, and overhead stay fixed, and contract count can be changed to test whether a larger size still leaves a hurdle consistent with tested or paper results.
- An order is placed only when the planned market conditions appear. A planned trade count cannot be manufactured to hit a breakeven quota.
Assembling expected value before entry
Average expected profit per trade can be assembled from win rate, contracts or shares, reward multiple, point value, initial risk in points, and round-trip commission. That quantity is expected value: the average expected profit or loss per trade after win rate, position size, stop distance, reward multiple, and round-trip commission are applied.
Initial risk is the planned loss distance from entry, measured in points, before size is applied. Commission analysis is the explicit inclusion of per-contract or per-share round-trip cost when computing expected value and the breakeven win-rate floor.
Rearranging the same identities
The trade count needed to cover a period's overhead equals that overhead divided by average expected profit per trade. Overhead is the fixed costs a trading period must cover, including platform, data, administration, slippage allowance, and a living wage in the source treatment.
Solving instead for the reward multiple needed to cover overhead treats win rate and trade count as known. The multiple moves inversely with the win rate, so the win-rate input is not independent of the multiple chosen.
A third rearrangement solves for the win-rate floor given a fixed reward multiple, a planned trade count, size, commission, and overhead. The breakeven win rate is the minimum share of winners required for expected value times trade count to equal overhead.
Reading a what-if matrix
Those identities can be placed in one spreadsheet that reports the breakeven win rate across reward multiples and trade counts while commission, size, and overhead stay fixed. That sheet is a what-if matrix: it maps reward multiple and trade count to the breakeven win rate while size, commission, and overhead remain unchanged.
The risk-reward ratio is the profit objective stated as a multiple of planned initial risk. It is used as a pre-entry filter for whether a period's overhead can be covered.
Breakeven win rate by reward multiple and weekly trade count
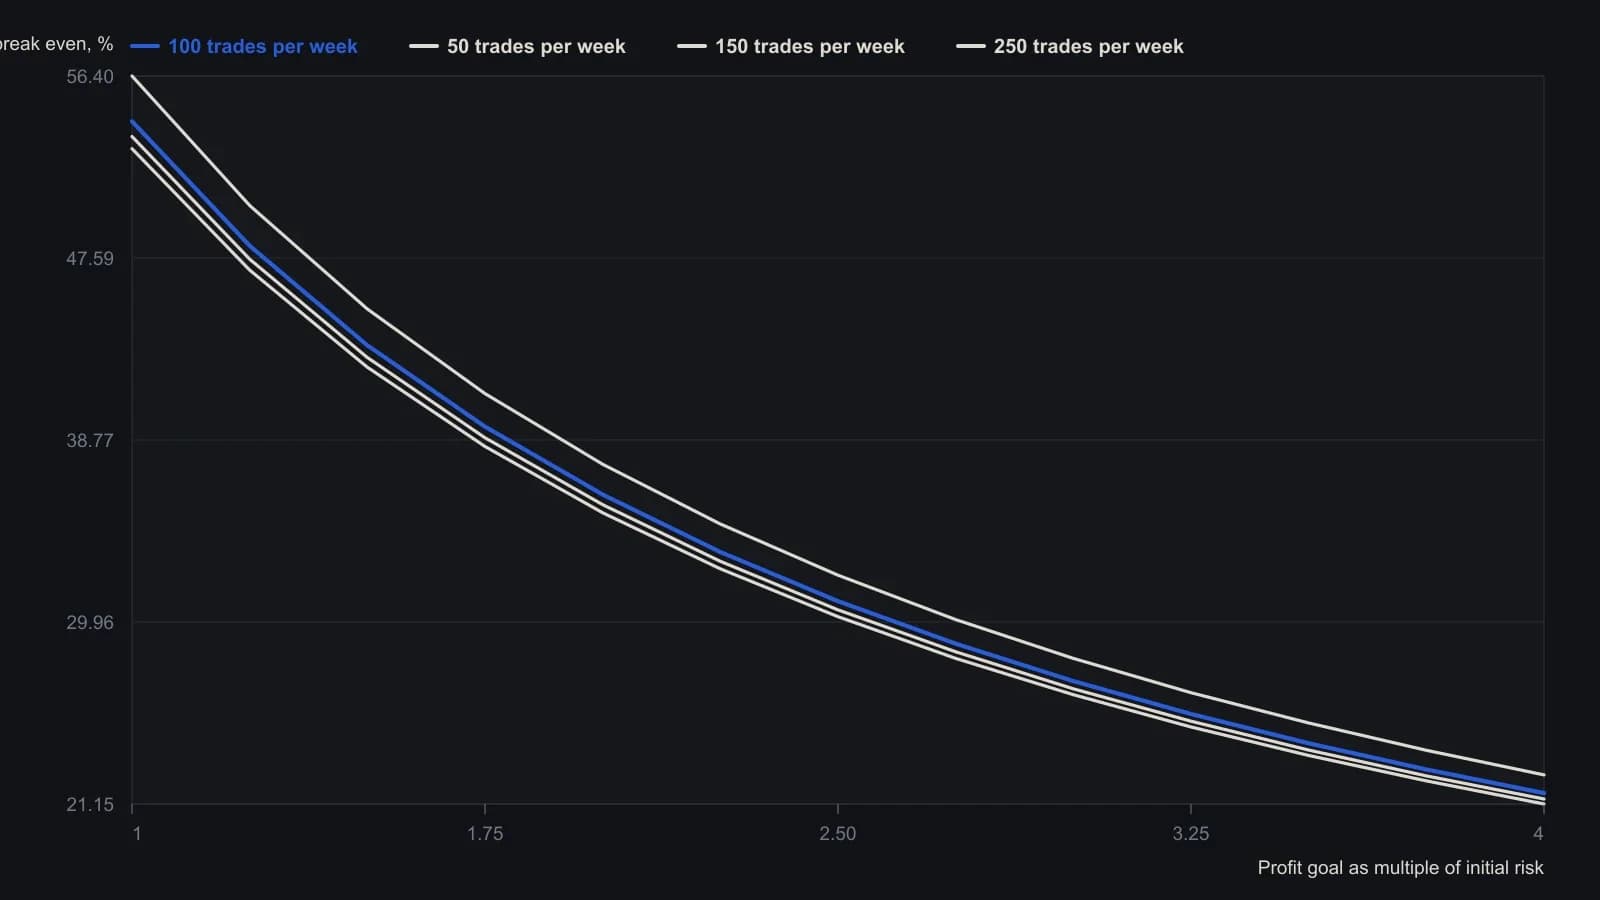
Source sheet holds point value at $250, initial risk at 1 index point, size at 2 contracts, round-trip commission at $10 per contract, and weekly overhead at $2,200 including pay and slippage.
A weekly worked case
One weekly worked case used a stock-index futures point value of 250 dollars, two contracts, a 10-dollar round-trip commission per contract, a one-point initial risk, and 2200 dollars of overhead that included platform costs, a slippage allowance, and a paycheck.
In that case, 100 trades in the week with a two-point profit target implied a 36.1 percent win-rate floor, or 37 wins out of 100, before overhead was covered.
The same grid can be read for frequency and target pairs whose required win rate is 40 percent or lower. Contract count can be changed to test whether a larger size still leaves a hurdle consistent with tested or paper results.
If a plan produces 150 weekly entries of which 45 percent move in favor, the grid indicated a profit target above 1.5 times initial risk as the combination that still cleared overhead.
Orders follow planned conditions
An order is placed only when the planned market conditions appear. A planned trade count cannot be manufactured to hit a breakeven quota.
All readings on this track · 22 readings
- 1995A pre-trade checklist that bounds loss before the order
- 1998Ledger audit of exits, payoff, and overlap
- 1998A return-to-loss filter for drawdown-aware evaluation
- 2000Pair historical volatility with return-to-loss filters
- 2001Credit-spread construction that can fail before any order is sent
- 2002Evaluating mechanical systems in a traders market
- 2002Profitability as a bound implied by RWL and commission
- 2004A day-trading breakeven matrix for size and win rate
- 2006Sit out, size and expectancy as one procedure
- 2006A testable intraday procedure from setup to stand-down
- 2007A planned liquidity offer at the inflection point
- 2011A style-neutral expectancy filter for system evaluation
- 2011Separate buying power from posted risk capital
- 2012Design before you trade: testing mechanical systems
- 2014Ideal trader hindsight as a pretrade filter
- 2014When expectancy and drawdown limits disagree
- 2015Signal, confirm, and invalidate before the trade
- 2015Price the win, stall, and loss before a stock entry
- 2016Construct expectancy by bounding losses and winner size
- 2017Estimate expectancy before you accept the trade
- 2017Size ladder tests for drawdown caps and expected value
- 2017Evaluate a high-yield correlation break as one locked procedure