1994issue C071-16
Late-cycle breadth as an allocation exam
A late-cycle tape is graded as a regime-diagnosis for allocation-stance, not as a price forecast. Cycle stage, policy pressure, and market-breadth decide whether cash-as-regime-tool becomes the active sleeve.
- Regime-diagnosis stacks cycle stage, policy pressure, and tape evidence to set allocation-stance. It does not predict a future high, low, or close.
- The stated goal is portfolio allocation that can capture an advance without returning those gains in the next decline, rather than frequent in-and-out timing.
- Market-breadth, a breadth-disparity lasting more than three months, and downside-leadership test whether a rally is still broadening before cash-as-regime-tool replaces aggressive sector exposure.
- Late-cycle-vulnerability and the year-end-peak-cluster warn that strong headlines and year-end optimism can arrive just as policy is pressured to tighten.
An allocation exam, not a price call
Technical work is treated as weighing evidence for bull-market ingredients and setting how aggressively to be invested. It is not treated as predicting a future high, low, or close.
The stated goal is portfolio allocation that can capture an advance without returning those gains in the next decline, rather than frequent in-and-out timing.
Editorial reading: this archive workflow is a regime-diagnosis that sets allocation-stance. The tape is graded as an allocation exam, not as a price forecast.
Locate the recovery stage
Equities are described as leading the economy by six to nine months. Peaks often arrive when economic news looks strongest and policy is pressured to tighten.
Early-cycle bull conditions are described as rising consumer confidence with still-low inflation pressure. Later-cycle vulnerability is described as high confidence, growth beating expectations, and inflation forcing higher rates.
That later stage is late-cycle-vulnerability: a mature recovery in which strong activity and high confidence raise inflation and rate pressure, so good economic headlines can be poor for equities.
Housing starts are used as a long-horizon confidence proxy. In July 1990 they were falling toward a seven-year low as the market peaked ahead of a decline.
Test whether policy is still an ally
The evidence set pairs technical factors, including sentiment, market-breadth, leadership, volume, and bellwethers, with monetary factors such as banking liquidity, credit demand, and monetary-aggregate growth.
Purchasing-manager commodity-price readings above 70 and a manufacturing sales-to-inventory ratio above 0.67 are presented as precursors of a rising consumer price index.
Editorial reading: policy is still an ally only while those monetary ingredients do not force higher rates into a mature recovery.
Ask whether participation is still broadening
A rally with fewer participating stocks is treated as a classic warning. Market-breadth is the participation and selectivity test, including advance-decline behavior versus a price average, used to see whether a rally is broadening or narrowing.
Breadth-disparity compares the rate of change in market-breadth versus price. A disparity lasting more than three months is treated as a danger signal that participation is diverging from the average. Both listed-exchange and over-the-counter disparity gauges peaked in October 1993.
In a 35-year review of 10 significant peaks, seven occurred between mid-November and mid-February. That year-end-peak-cluster is attributed to year-end optimism leaving more room for disappointment.
Sentiment-overcrowding uses issuance and secondary-offering heat as early, countertrend signs that the bullish crowd is crowded, with the caveat that danger levels do not repeat at the same reading.
NYSE and OTC breadth disparity, November 1992 to April 1994
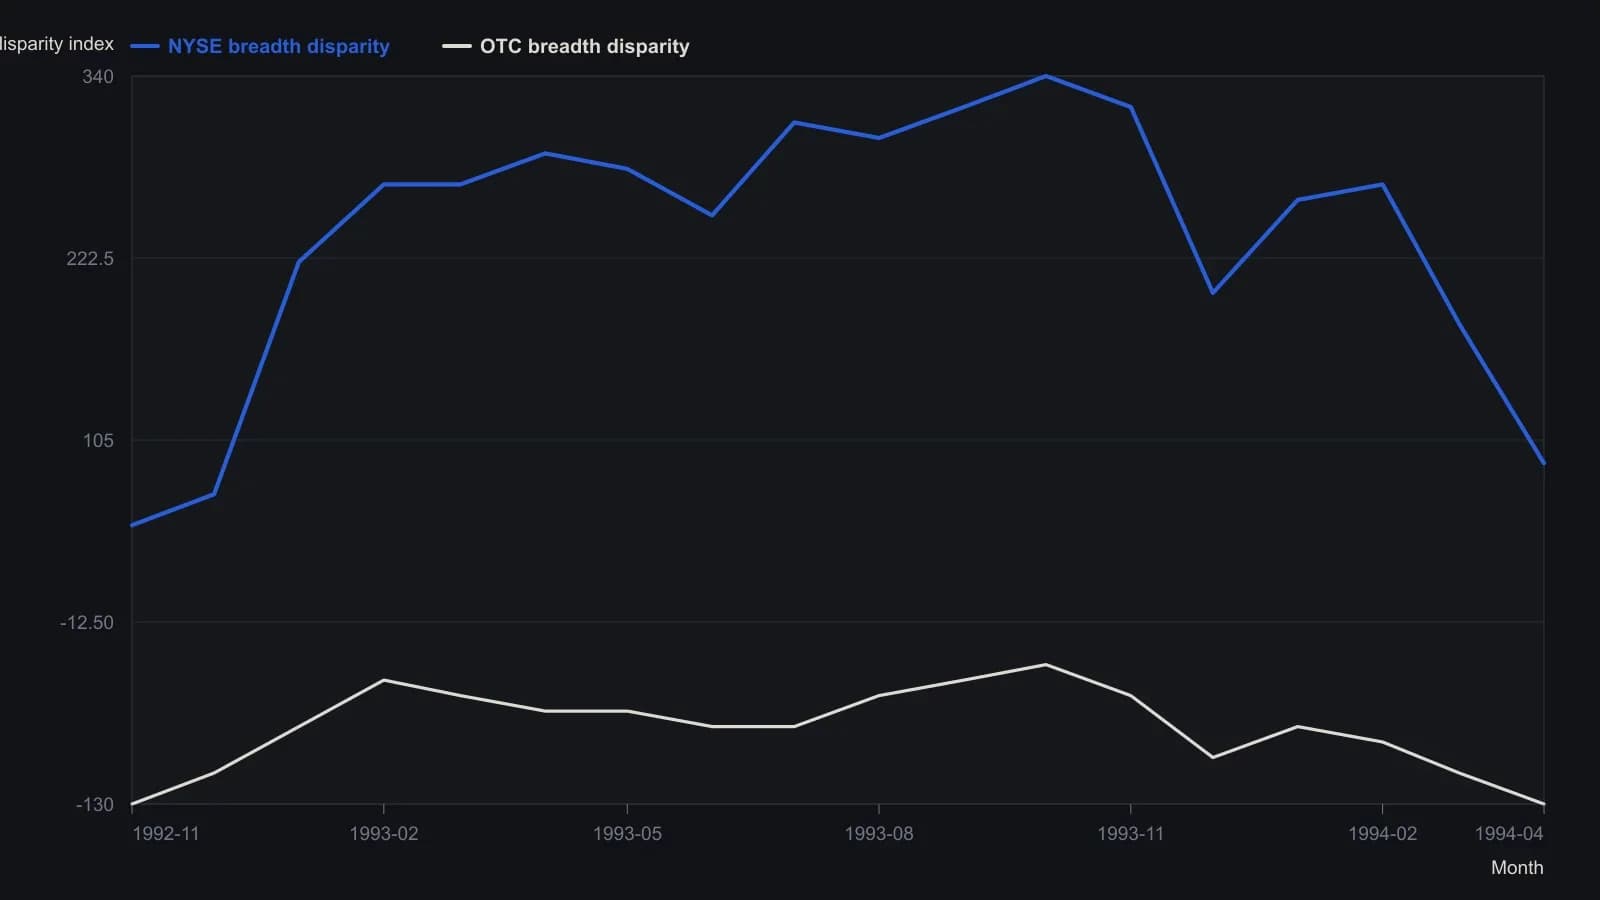
No numeric table was printed. These are approximate monthly samples from the raster, so treat them as shape and turning-point evidence rather than official index prints.
When cash becomes the active sleeve
Downside-leadership is an increase in new yearly lows that includes losing names. It is used to distinguish a bear regime from profit-taking in a correction.
Allocation-stance then shifts between aggressive sector exposure and cash. Cash-as-regime-tool treats money-market or similar cash holdings as a valid allocation when a correction or bear regime is judged more likely.
Editorial reading: cash is not a call on the next close. It is the sleeve that becomes active when regime-diagnosis no longer supports an aggressive equity stance.
All readings on this track · 26 readings
- 1990Stress-testing a futures sleeve across equity regimes
- 1990Staged sleeves from one equity forecast
- 1990Score a trade after allocation, diversification, and a drawdown limit
- 1993A three-sleeve regime map for equities, rates, and futures
- 1994Late-cycle breadth as an allocation exam
- 1994Ratio MACD crossover as a portfolio weight filter
- 1995Sizing a trend futures sleeve in a 1995 policy shift
- 1996A 1990s case on liquidity cycles, rank rotation, and cross-market sleeves
- 1997Regime-aware allocation versus binary timing
- 1998Hedge-fund sleeves under a hard drawdown limit
- 2010True diversification as portfolio construction
- 2012Regime-gated trend baskets and layered sizing
- 2013Score fund cost drag before the equity-versus-defensive mix
- 2013Cost-first fund mix in portfolio construction
- 2015Cost-first fund construction and the stock-bond mix
- 2016Audit the fund cost-stack, then set the sleeve-mix
- 2016Read fund listings through costs, then allocation, then diversification
- 2017A four-channel own-account book with signal-replacement
- 2017Listed REITs as a standalone portfolio sleeve
- 2017Cost-first stock and bond fund construction
- 2017Cost-first fund mix in a diversified portfolio
- 2018Mutual-fund costs come before returns in portfolio mixes
- 2018Cost gates before a stock-bond fund mix
- 2019Cost-stack and bond-equity mix around a trade
- 2019Evaluate diversification by correlation, not by the mix label
- 2020Cost-first fund sleeves and a stock-bond mix