1997issue C041-4
Long-term trend following and pyramiding as one holding-period procedure
An archive case study treats long-horizon market direction as a single holding-period workflow: stay with the macroeconomic trend until conditions reverse it, and add only to already profitable positions that still match that trend.
- The source treats long-horizon market direction, once created by macroeconomic conditions, as the primary source of gains and losses, and holds that the direction continues until a new set of conditions is strong enough to reverse it.
- Trend-following takes the same side as that long-horizon move and stays with it; pyramiding adds only to an already profitable position aligned with the prevailing trend, rather than enlarging exposure against it.
- A defined objective matched to the current environment is presented as a more stable basis for participation than year-to-year reversals in published fund ranks.
- Editorial reading: confirmation that the trend remains in force, then adding only when that same trend is already profitable, turns entry, scale-up, and abstention into one testable rule set.
Long-horizon direction as the holding period
The source treats long-horizon market direction, once created by macroeconomic conditions, as the primary source of gains and losses. That direction is held to continue until a new set of conditions is strong enough to reverse it.
Trend-following, as used here, is a procedure that takes the same side as that long-horizon move and stays with that side until reversal conditions appear. A 12-month moving-average procedure applied to 25 commodities is presented as a systematic way to stay aligned with those moves. The tabulated series is described as showing a single losing calendar year in 1992.
Regime change as confirmation
The source contrasts a long inflationary bond-market decline from the mid-1960s through 1982 with a later regime in which policy shifted toward borrowing rather than money creation. It treats 1982 as the point when both bonds and stocks became a major buy under that new regime.
As of January 1997 the source describes a United States equity advance lasting 268 months, second only to a 288-month Japanese advance, as the long-horizon backdrop against which style-consistent trend participation is discussed.
Adding only when the trend is already profitable
The source presents adding to winning positions that already sit on an existing trend as a distinct, style-consistent way to participate in long-horizon currency moves. That approach is contrasted with refusing to add names that do not match an investor's established style.
Pyramiding, as defined here, means adding to an already profitable position that is aligned with the prevailing long-term trend, rather than initiating or enlarging exposure against that trend.
A defined objective instead of published ranks
Year-to-year rank reversals among funds are used to argue that published past results are an unstable basis for choosing a manager. Knowing a defined objective and matching it to the current environment is the proposed alternative.
Annual total-return rates for the Barra/MLM Index and the S&P 500, 1961–1996
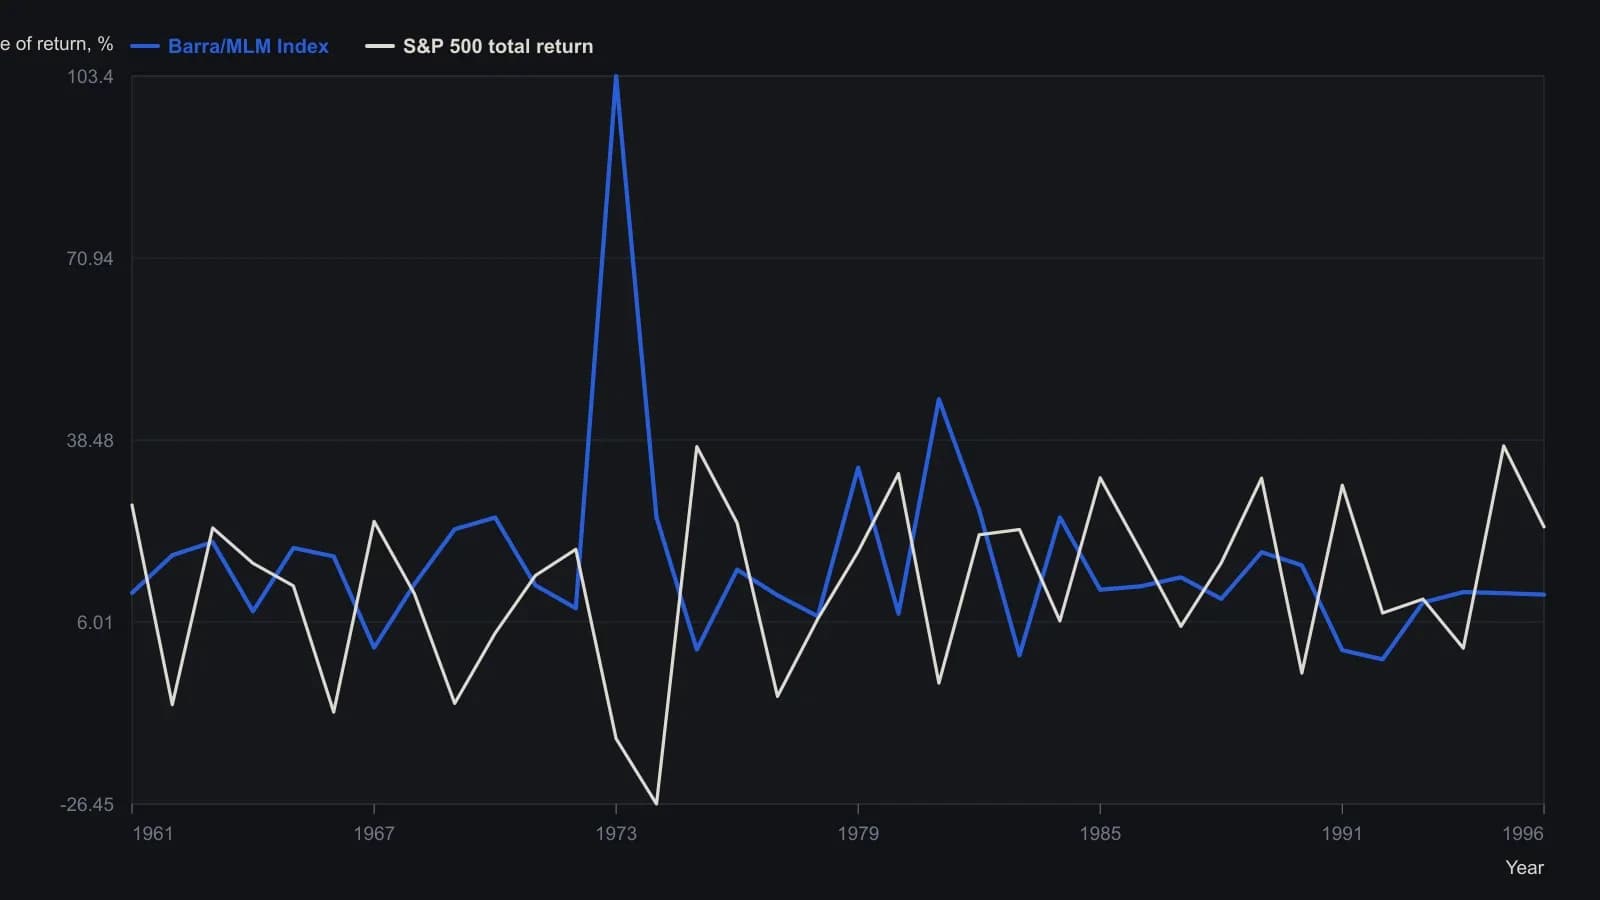
The article’s MLM construction is a monthly 12-month moving-average rule on 25 commodities, equally money-weighted and rebalanced at month-end. Compounded growth on the separate hypothetical $1,000 chart is not used here.
All readings on this track · 17 readings
- 1982Six-category classification as a trend and pyramiding case study
- 1986Fear signals an untested decision process
- 1987Paper lots, stop orders, and pyramids as a Wyckoff apprenticeship
- 1992A pre-trade checklist for locked stops and trend pyramiding
- 1992Stop-first pyramid adds from locked profit
- 1997Long-term trend following and pyramiding as one holding-period procedure
- 1999Pyramiding after a maximum favorable excursion support
- 1999Confirm early scale-ins, then shrink late units
- 2004Stacking crossovers, MACD and pyramiding across currency timeframes
- 2008Scale in after launch confirmation
- 2008Range-breakout trend entries with early stops and pyramids
- 2015Why win-rate chasing fails the decision process
- 2016Expectancy through loss cuts, add-ons, and bounded leverage
- 2018Wide-range breakout, trailing stops, and pyramiding
- 2019Inverse ETF pair daytrading with pyramiding and a trailing stop
- 2019One procedure for breakout entry, trailing stops, and pyramid adds
- 2020Scale-in construction for swing breakouts