2018issue C1150-58
Wide-range breakout, trailing stops, and pyramiding
This archive case study writes a breakout as four sequential rules: a 20 percent high-low range on a 15-day uptrend chart, an entry a half-dollar above the current high, a two-dollar initial stop, and an add to winners every two dollars.
- The case study writes a breakout as a complete procedure: a wide-range filter, an entry above the current high, an initial stop, and a pyramid add only after a stated two-dollar move.
- Range size is treated as more important than the visual chart pattern, because a narrow range produces more false breakouts than a wide one.
- Tight initial and trailing stops pair with the breakout, and an early pullback or consolidation after entry is a reason to exit sooner rather than later.
- A related stiffness implementation buys above a 90 threshold when the market trend average is non-declining, sells under 50 or after 84 bars, and can use a 21-day inactivity stop that requires a 100 percent minimum change.
Four sequential rules
A wide-range breakout procedure can be written as four sequential rules: require at least a 20 percent high-low range on a 15-day chart in an uptrend, enter a half-dollar above the current high, place a two-dollar initial stop, and add to winners every two dollars.
Those four steps are a breakout system: a complete entry, exit, and abstention procedure that waits for price to leave a defined range and then applies the same testable rules through the holding period.
Why range size comes first
The same case study treats the size of the trading range as more important than the visual chart pattern, because a narrow range produces more false breakouts than a wide one.
The first rule is a wide-range filter: a pre-entry screen that requires a large high-to-low range on a short lookback so the breakout is not taken from a tight, false-breakout-prone band. The stated screen is a 20 percent high-low range on a 15-day chart, and only in an uptrend.
Initial and trailing stops
The entry is a half-dollar above the current high, and a two-dollar initial stop is written as part of the same procedure.
Trade management in the case study pairs the breakout with tight initial and trailing stops. A trailing stop is a risk bound that starts as a fixed initial stop and then follows the position so a loss or exposure decision stays limited before and after entry. An early pullback or consolidation after entry is treated as a reason to exit sooner rather than later.
Adding only after a stated move
The fourth rule adds to winners every two dollars. That is pyramiding: a rule for adding to a winning position only after price has already moved a stated increment in the trade's favor.
A stiffness reading as another breakout screen
A related stiffness-based breakout implementation buys when a three-bar smoothed stiffness reading crosses above a buy threshold of 90 and a second-data-series market trend average is non-declining. It then sells on a cross under a sell threshold of 50 or after 84 bars.
Stiffness itself is computed by counting closes above a moving average that has been lowered by two-tenths of its own standard deviation, then scaling that count by the moving-average length over the stiffness lookback.
Default stiffness parameters used across the supplied implementations are a 100-bar moving average, a 60-bar stiffness count, a 90 buy threshold, and three-bar exponential smoothing of the indicator.
Stiffness-strategy annualized return versus SPX and NDX
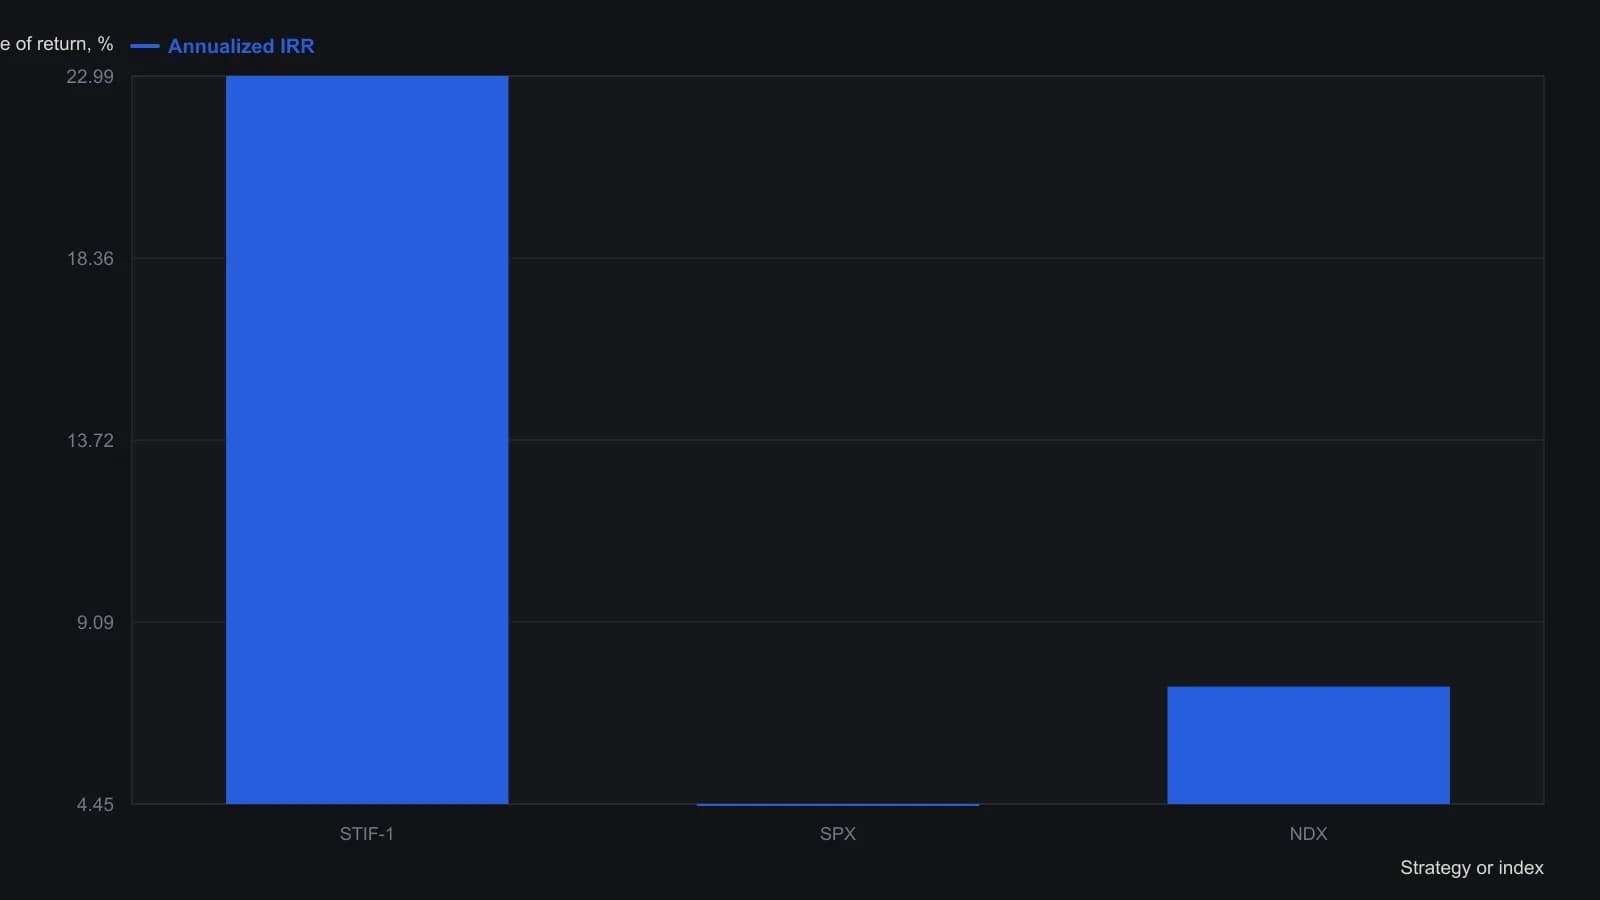
The same table lists total IRR of 5807.14 for STIF-1 versus 336.25 (SPX) and 311.36 (NDX), sigma of 25.36 / 19.25 / 27.43, and Sharpe ratios of 0.91 / 0.23 / 0.27. Surrounding Traders’ Tips code holds the moving-average length at 100 bars, the stiffness lookback at 60 bars, a buy threshold of 90 and a time stop of 84 bars.
Time without progress as an exit
A stiffness system test pairs the same entry and exit thresholds with a 21-day inactivity stop on long positions that requires a 100 percent minimum change. An inactivity stop is a time-based exit that closes a position if price has not made a required change within a stated number of bars, which makes time without progress an explicit exit rule.
All readings on this track · 17 readings
- 1982Six-category classification as a trend and pyramiding case study
- 1986Fear signals an untested decision process
- 1987Paper lots, stop orders, and pyramids as a Wyckoff apprenticeship
- 1992A pre-trade checklist for locked stops and trend pyramiding
- 1992Stop-first pyramid adds from locked profit
- 1997Long-term trend following and pyramiding as one holding-period procedure
- 1999Pyramiding after a maximum favorable excursion support
- 1999Confirm early scale-ins, then shrink late units
- 2004Stacking crossovers, MACD and pyramiding across currency timeframes
- 2008Scale in after launch confirmation
- 2008Range-breakout trend entries with early stops and pyramids
- 2015Why win-rate chasing fails the decision process
- 2016Expectancy through loss cuts, add-ons, and bounded leverage
- 2018Wide-range breakout, trailing stops, and pyramiding
- 2019Inverse ETF pair daytrading with pyramiding and a trailing stop
- 2019One procedure for breakout entry, trailing stops, and pyramid adds
- 2020Scale-in construction for swing breakouts