2004issue C111-6
Stacking crossovers, MACD and pyramiding across currency timeframes
Currency entries can be written as one permission-trigger-add script. The longer moving-average and MACD regime licenses the idea, the shorter crossover decides action or abstention, and pyramiding is allowed only after a lower-timeframe conflict snaps back into line.
- Start directional work on a higher-timeframe chart. Use shorter charts only after that multiple-time-frame-bias is set, and only to locate entries and exits.
- Treat the moving-average-crossover and the macd-histogram as one license. Stay in abstention while the entry chart and the confirmation-chart disagree.
- On daily EUR/USD, support-turned-resistance plus trade below a 20-day simple moving average is read as a near-term downtrend, then timed on hourly averages and 15-minute range breaks.
- Add size through pyramiding only after a shorter chart that had disagreed returns to the higher-timeframe signal, and close when the longer confirmation-chart reverses.
One permission-trigger-add script
This archive piece records a currency workflow as a single script rather than as three detached tools. Editorial reading: the longer moving-average and MACD regime licenses the idea, the shorter moving-average-crossover decides action or abstention, and pyramiding is allowed only after a lower-timeframe conflict snaps back into line.
Directional work starts on a higher-timeframe chart. Shorter charts are used only after that bias is set, and only to locate entries and exits. That order is the multiple-time-frame-bias: a longer chart sets directional permission before any shorter chart is allowed to time an entry or exit.
How direction is licensed
A moving-average-crossover sets direction. The rule is long when the shorter average moves above the longer average and short when the shorter average moves below it.
MACD is read with that dual moving-average crossover as one procedure. The MACD fast line is the gap between a 12-period and a 26-period exponential moving average, and the signal line is a nine-period exponential average of that gap.
The macd-histogram is the plotted difference between the fast line and the signal line. A histogram above zero is treated as buyer strength and a histogram below zero as seller strength. A long setup is described when the MACD fast line crosses above the slow line and price is also above a 7-period or 50-period moving average.
USD/CHF four-hour rally that licenses the long
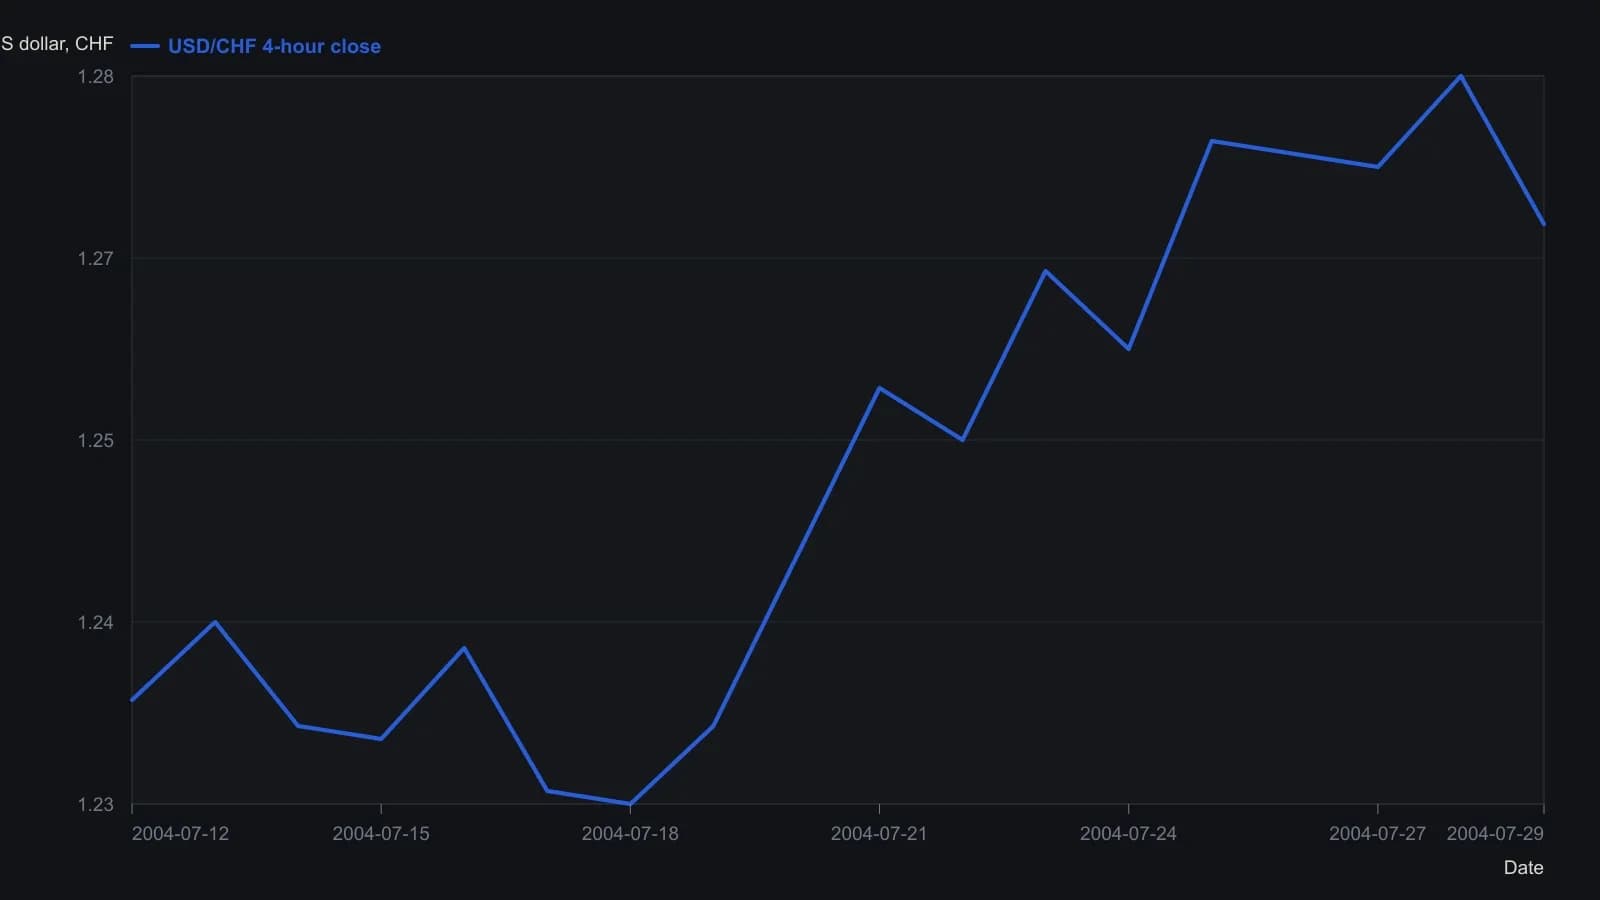
The pane labels only 07/18 and 07/25; dates between and beyond those ticks were spaced from that pair. Year 2004 follows the other figures in the same article. Closes are approximate to about 0.001 except the printed 1.2696. MACD(12,26,9) sits under the price pane in the source but uses a different scale, so it is not drawn here.
When the second screen must agree
The confirmation-chart is a second screen set to about twice the entry chart's length. The pairing is illustrated by a two-hour trigger with a four-hour confirmation screen. That second screen is required to agree before a trade is opened or enlarged.
When the entry chart and the confirmation-chart disagree, the script calls for abstention. The position stays flat until both screens line up.
Currency screens
On daily EUR/USD, a break of former support that later acts as resistance, plus trade below a 20-day simple moving average, is read as a near-term downtrend. That support-turned-resistance, with moving-average location, marks a change in regime.
Hourly EUR/USD trade below both a 10-period and a 20-period simple moving average is used to confirm that daily sell bias. After that confirmation, 15-minute range breaks mark short entries.
A daily GBP/USD advance from May 2001 is treated as a reason to buy hourly pullbacks rather than to sell new highs. The daily advance is the permission. The hourly pullback is the trigger.
Adding size and leaving
Size may be added through pyramiding only if the shorter chart returns to the higher-timeframe signal after a conflicting print. A conflict on the shorter chart is not itself a reason to add.
The position is closed when the longer confirmation-chart reverses.
All readings on this track · 17 readings
- 1982Six-category classification as a trend and pyramiding case study
- 1986Fear signals an untested decision process
- 1987Paper lots, stop orders, and pyramids as a Wyckoff apprenticeship
- 1992A pre-trade checklist for locked stops and trend pyramiding
- 1992Stop-first pyramid adds from locked profit
- 1997Long-term trend following and pyramiding as one holding-period procedure
- 1999Pyramiding after a maximum favorable excursion support
- 1999Confirm early scale-ins, then shrink late units
- 2004Stacking crossovers, MACD and pyramiding across currency timeframes
- 2008Scale in after launch confirmation
- 2008Range-breakout trend entries with early stops and pyramids
- 2015Why win-rate chasing fails the decision process
- 2016Expectancy through loss cuts, add-ons, and bounded leverage
- 2018Wide-range breakout, trailing stops, and pyramiding
- 2019Inverse ETF pair daytrading with pyramiding and a trailing stop
- 2019One procedure for breakout entry, trailing stops, and pyramid adds
- 2020Scale-in construction for swing breakouts