2002issue C111
Name the regime and the season before choosing a long put
Before an index-options idea is treated as testable, name the implied-volatility regime, name the seasonal window being assumed, and only then ask whether a long put is the cheaper vehicle in that market regime.
- A listed volatility-index reading at or below 20% was treated as a calm-market regime with a positive near-term outlook; a reading above 35% was treated as a nervous regime with an uncertain near-term outlook.
- Seasonal analysis examined two calendar hypotheses, long index calls near the end of October and long index puts after April 15, and still required a check against option premium.
- One illustrated long-put procedure bought index puts when the volatility index traded below 20%, on the grounds that options were then generally cheap, and used expirations of at least 60 days so the position could last through a 30-to-60-day window.
- Editorial view: the testable idea is the combination of implied volatility, seasonal analysis, and a long put, not a standalone volatility, calendar, or options tip.
A three-check habit
Before this archive treated an index-options idea as testable, it asked for three labels in order. First, name the implied-volatility regime. Second, name the seasonal window being assumed. Third, ask whether a long put is the cheaper vehicle in that setting.
Implied volatility is a market-priced estimate of expected movement. Here it was read from a listed volatility index and used to label a calm versus nervous regime rather than to time a single ticker. Seasonal analysis was a calendar hypothesis about typical post-October strength and post-mid-April weakness. A long put was a defined-risk options structure that gains if the underlying index falls. In this write-up it is the vehicle paired with cheap implied volatility or with a seasonal fade, not a standalone signal.
Name the implied-volatility regime
The volatility index was used as a chartable gauge of index-option implied volatility and as a fear or nervousness measure. Its low and high zones were regime labels for a weeks-to-months market context.
A listed volatility-index reading at or below 20% was treated as a calm-market regime with a positive near-term outlook. A reading above 35% was treated as a nervous regime in which the near-term outlook was uncertain.
As of September 2002 the same index had stayed above 40% for nearly a month. The archive called this a rare prolonged high-fear stretch and used it to argue that a low-volatility reading was unlikely soon.
In a five-year tracking window, an equity-index correction was described as typically arriving within 30 to 60 days after the volatility index fell below 20%. A five-event sample of sub-20% prints showed a 30-day equity-index decline in four cases and a 30-day rise in one case.
Editorial view: those prints belong in the first check, as market-regime labels, before any options structure is chosen.
Name the seasonal window
Two seasonal hypotheses were examined. One was long index calls near the end of October. The other was long index puts after April 15.
A frequent post-October equity rise was linked to the lifting of the prior month's downward pressure. April was described as a period when markets often faded as a correction.
After a large October decline, index-option premiums were described as often two or three times September levels because of a volatility spike. That made long calls into a year-end bounce expensive.
Editorial view: a seasonal window is a testable calendar hypothesis, not an automatic trade. It still has to be checked against option premium.
Then ask whether a long put is cheaper
Option premium is the price paid for the option. The archive treated it as regime-dependent: cheap when implied volatility is depressed, and often much richer after a volatility spike.
One illustrated procedure bought index puts when the volatility index traded below 20%, on the grounds that options were then generally cheap, and used expirations of at least 60 days so the position could last through a 30-to-60-day window.
In a rising market, premiums were described as usually low, so a long put intended to fade a later decline would typically be cheaper than the same put bought after implied volatility had already jumped.
Editorial view: the long put is the third check, not the first. It is how a cheap-premium or seasonal-fade idea was expressed once the regime and the window had already been named.
Dow move in the 30 days after VIX dropped below 20%
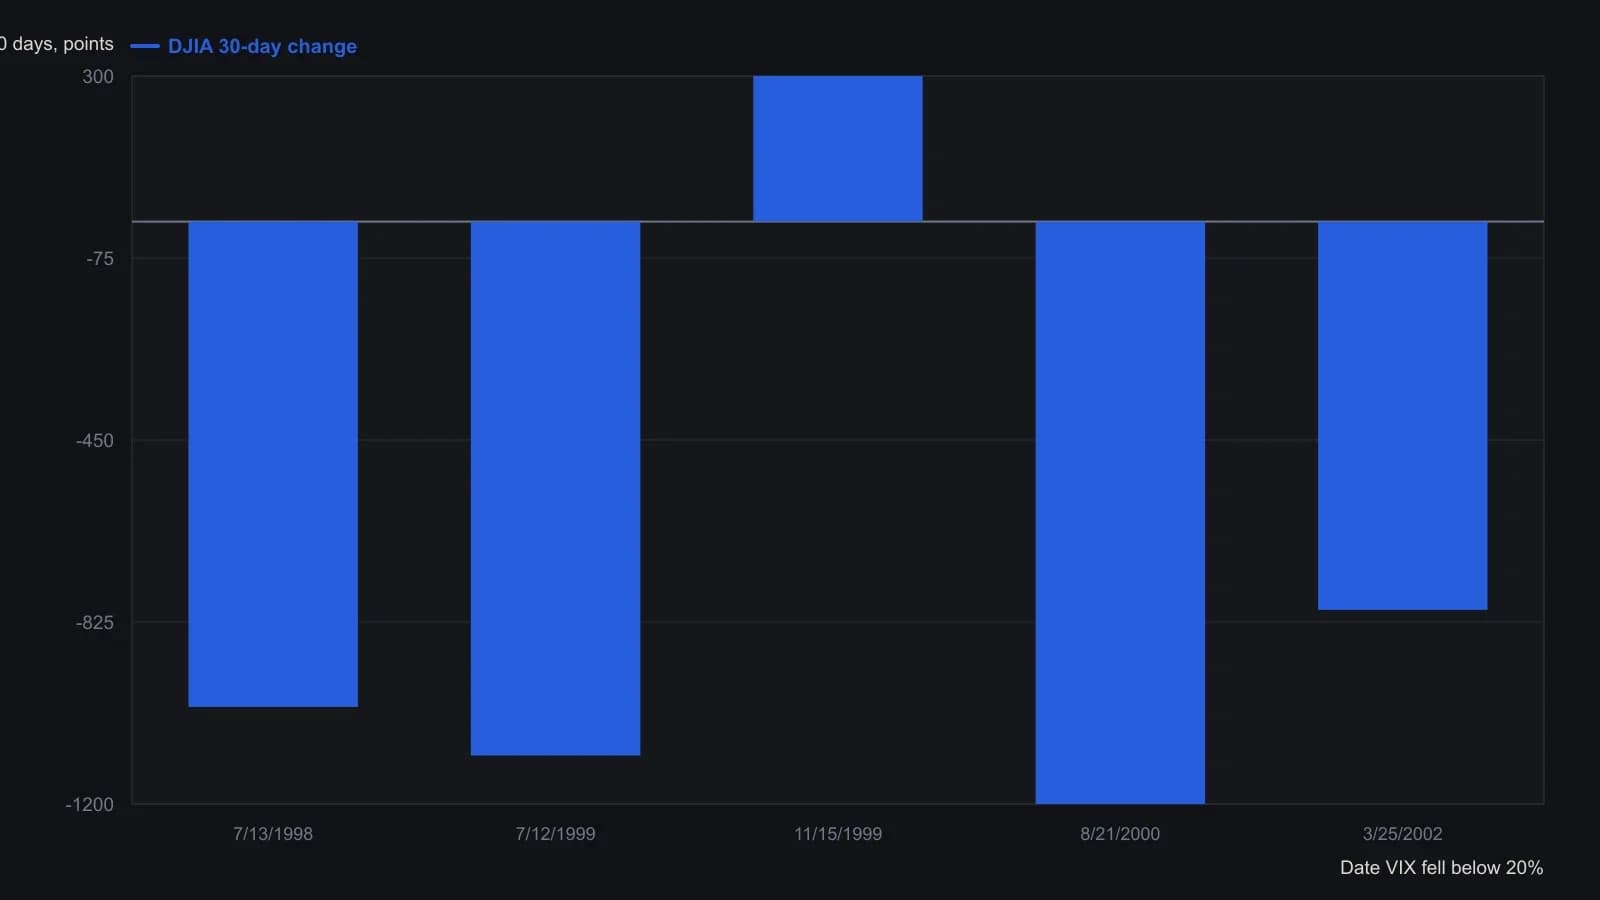
Each row is a VIX print below 20 percent. The Dow figure is only the change Gentile recorded over the next 30 days, not a peak-to-trough drawdown.
The combination is the test
A market regime, in this archive, was a weeks-to-months context inferred from implied-volatility extremes and seasonal windows. It was used to place one options structure in a broader setting.
Editorial view: an idea that names only implied volatility, only a calendar date, or only a long put is incomplete relative to this workflow. The testable procedure is the three-check combination.
All readings on this track · 22 readings
- 1984A long silver put as a prepaid loss cap
- 1984Spectral window gates for index long puts
- 1990Breadth nonconfirmation as the gate for a volume fade and long-put case
- 2002Volatility-first construction for a bearish put or debit
- 2002Name the regime and the season before choosing a long put
- 2005Critique of put spreads versus outright long puts
- 2007Sector put hedges, automatic exercise, and pin risk
- 2008Margin shock, defined-debit options, and selective premium
- 2008Ranking in-the-money puts by breakeven rather than cheapest premium
- 2012Evaluating long-put moneyness when implied volatility shifts
- 2012Sizing a long butterfly for early assignment and a long option for gamma
- 2013Gold after the April break: option-spread vehicles and a long-put hedge
- 2014A defined-risk option case for the mid-February to mid-July energy window
- 2014Long put versus vertical debit spread on a Treasury ETF
- 2015Defined debit call spread on a health-insurer worksheet
- 2015Overbought technology index: a long put via an inverse proxy
- 2018Replace futures stops with short-dated long puts
- 2018Constructing short-dated long puts around weekly expiration
- 2018Four decisions before a portfolio protective put
- 2018Incremental producer hedging with puts and risk reversals
- 2019Put butterfly versus long put in a volatility spike
- 2020Scenario-first SPY put hedge: butterfly versus long put