2018issue C0720-23
Evaluating trend, breakout, and regression rules by average robustness
A historical comparison locked each trend measure to one free parameter, applied the same direction-change wrapper, and graded trend following, a breakout system, and a linear-regression slope by average robustness across a 30-to-150-day band and four futures sectors.
- Each trend measure used one free parameter so extra rules would not tilt the ranking toward overfitting.
- Every method shared the same trend-following wrapper: a direction-change signal filled on the next open, with no profit target or protective stop.
- Robustness was judged from the average across calculation periods and four futures sectors, not from one peak window.
- Average ranking and risk shape were separate questions: a moving average cut losses quickly with many small losers, a breakout held through wide swings with fewer trades, and the regression slope sat between those profiles.
A locked comparison of trend measures
Each trend measure in the comparison was limited to one free parameter so that extra rules would not tilt the ranking toward overfitting. Linear regression entered as a slope on ordered prices, and the breakout system bought new highs and sold new lows. Both sat inside a trend-following wrapper that treated entry, exit, and remaining flat as one procedure.
One wrapper and three measures
Trend-following is a complete directional procedure that buys when the measured trend turns up and sells when it turns down, with no separate target or stop, so entry, exit, and staying out are one testable rule.
The breakout system is a one-parameter rule that goes long on a new high and short on a new low and leaves the position unchanged while price stays between those extremes.
Linear regression is a slope fitted to ordered prices over a fixed lookback. The sign of that slope is the forecast that becomes the directional signal.
Every method used the same execution wrapper: buy when the trend turns up, sell when it turns down, fill on the next open, and apply no profit target or protective stop.
Direction-change signals
Signals in the comparison were triggered by a change in trend direction rather than a price cross of the trend line, because the line was treated as the filter for noisy prints. A direction-change signal is an entry or exit taken when the trend measure itself flips, filled on the next open, rather than when price crosses a plotted line.
Calculation period and market grid
The calculation period is the single free lookback applied to each method and swept from 30 to 150 days, the band treated as typical of slower, policy-linked moves.
The grid covered four futures sectors: long-term bonds, the euro, an equity-index contract, and crude oil, from 1991 through March 2018, with a fixed cost charged on each side of a contract.
Average robustness, not a peak window
A single best window was rejected as the ranking statistic because isolated spikes can come from lucky timing around shocks. The average across all windows was used instead.
Robustness is the ability to remain useful across many lookbacks and across markets with unlike noise and path structure, judged from the average of the whole grid rather than from one peak window. The historical test asked the same thing: work across many calculation periods and across markets that represent different sectors and price patterns.
Ranking and risk shape stay separate
Average ranking and risk shape were treated as separate evaluation questions. A moving average tends to cut losses quickly with many small losers, a breakout holds through wide swings with fewer trades, and the regression slope sits between those two profiles.
US 30-year bond futures at 80 days: net profit versus drawdown
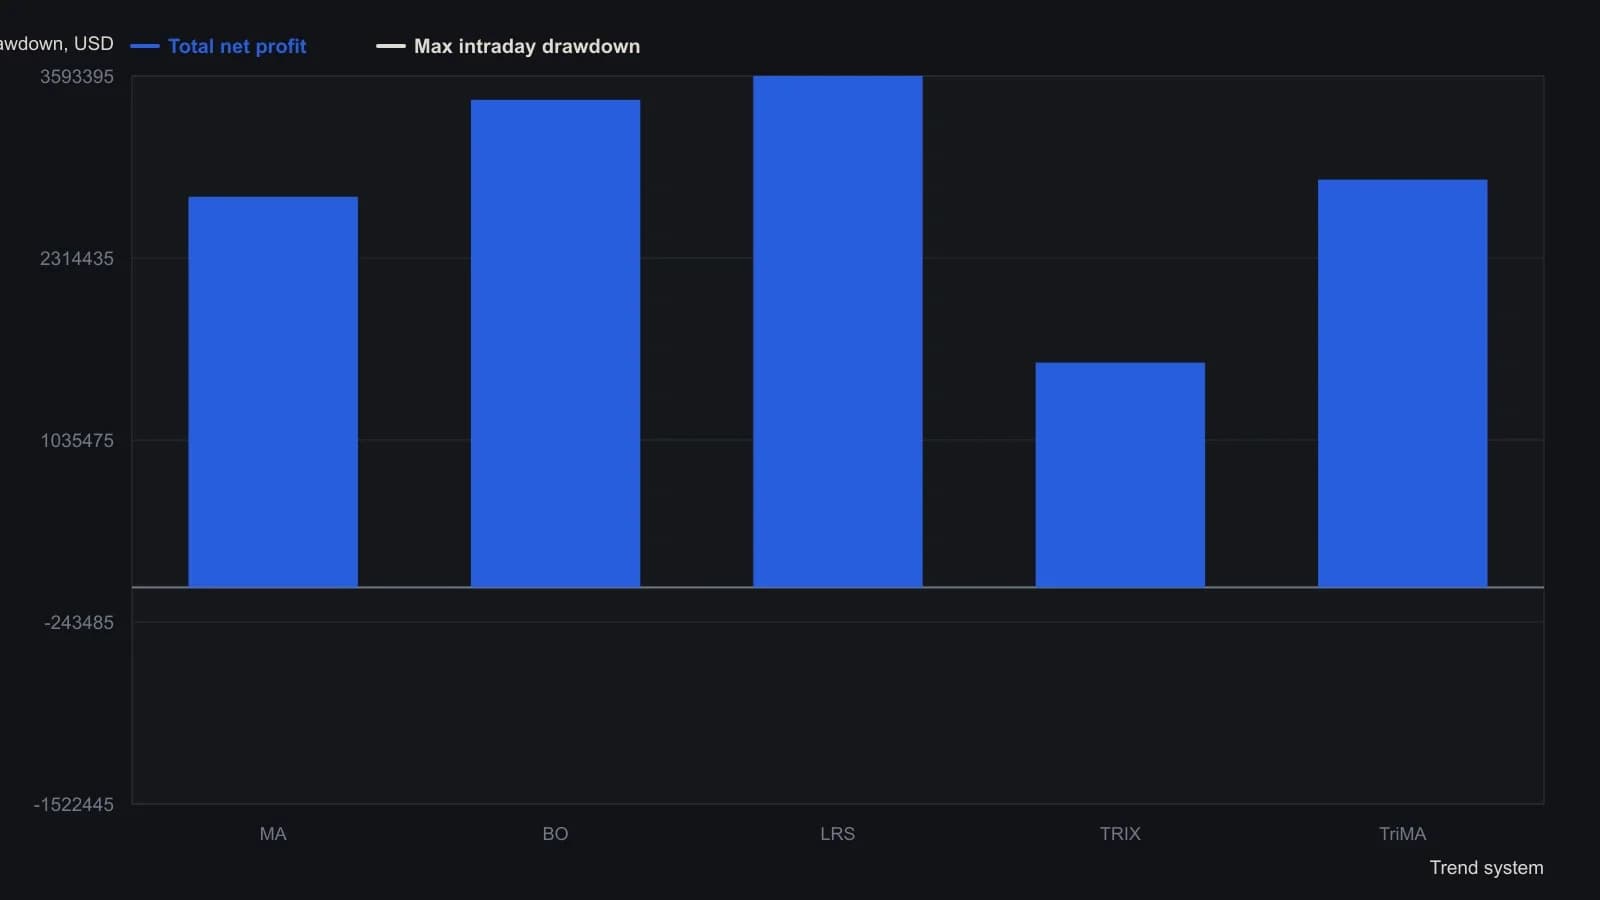
Each rule is locked to an 80-day calculation period; $8 per contract per side. The source notes that TradeStation profit factor uses closed-trade results and therefore omits risk inside the trade.
All readings on this track · 23 readings
- 1995Range breakout rules with an expansion filter and moving-average exits
- 1995Write a weekly breakout as one parameterized entry and exit
- 1995Combining a trend rule, a breakout trigger, and a seasonal filter
- 1996Constructing a two-bar clearance breakout from a twenty-session exponential average
- 1996Two-bar exponential-average breakout as setup, stop, and flatten
- 1998A noise-offset breakout judged after walk-forward re-estimation
- 1998Gating a weekly average crossover with stored support and resistance
- 1998Moving-average candidates gated by support and resistance
- 2000Constructing next-close envelope targets for breakout stops
- 2001February soybean high breakout and June trailing stop
- 2005Box-and-breakout states written as ordered entry and exit rules
- 2007Match trend and breakout rules to the market condition
- 2010How a JM internal band becomes long and short entry and exit rules
- 2013Constructing a three-average trend-aligned breakout system
- 2016Volume-confirmed breakout entry rules
- 2017How to construct exponential standard deviation bands
- 2017Four-day green candle breakout as one swing procedure
- 2018Constructing inverse ETF breakouts above a 200-day average
- 2018Evaluating trend, breakout, and regression rules by average robustness
- 2019A crypto pair breakout after a sideways range
- 2019Next-session breakout rules after a high-volume close
- 2020Altcoin dual-stop breakout with a timed exit
- 2020Critiquing required stops in mechanical breakout systems