2017issue C0248-54
How to construct exponential standard deviation bands
A familiar volatility envelope can be rebuilt with an exponential average as the midline and a matching lookback deviation. The same three-line construction can sit beside a separate trend-strength reading or be checked as a fully specified breakout system.
- Exponential standard deviation bands keep the shape of a familiar volatility envelope, but the midline is an exponential average of price rather than a simple average.
- Exponential-standard-deviation is the square root of the average squared distance between each lookback price and that exponential midline, and a common default uses a 20-period lookback with the outer bands two deviations away.
- The envelope is presented as a confirming overlay beside a separate average-directional-index reading, with percent-b locating price and band-width-percentage marking unusually narrow envelopes.
- Two illustrated breakout-system procedures specify entry, position limits or exits, and one rule set can be restated on simple-average bands for a same-period comparison.
What the envelope is
Exponential-standard-deviation-bands are a three-line envelope. The midline is an exponential moving average of price, and the outer lines sit a chosen multiple of an exponentially referenced standard deviation above and below that midline.
The bands are built like a familiar volatility envelope, except the midline is an exponential average of price rather than a simple average.
How the bands are built
Exponential-standard-deviation is the square root of the average squared distance between each lookback price and that exponential midline. It is the square root of the mean squared distance between each price in a fixed lookback and the exponential moving average of that same lookback.
A common default construction uses a 20-period lookback and places the outer bands two deviations from the exponential midline.
The envelope is intended to widen when volatility rises and contract when volatility falls, so it can show whether current movement is unusual while a market is trending.
Locating price and marking narrow envelopes
Percent-b locates price inside the envelope: 1 at the upper band, 0 at the lower band, and 0.5 on the exponential midline.
Band-width-percentage is the current distance between the outer bands expressed as a fraction of the midline. It is used to mark unusually narrow envelopes.
Two specified breakout procedures
A breakout-system is a fully specified entry, position-count, and exit procedure that fires when price or band width crosses a stated threshold and later exits on a stated opposite condition.
One illustrated breakout procedure buys when band-width-percentage stays below 0.2 for three consecutive days, allows at most three open positions, and exits when that width reading later expands through a stated threshold.
A parallel breakout construction buys when the exponential midline is rising and close first crosses above the upper band, then exits when the low falls below the lower band. The same rule set can be restated on simple-average bands for a same-period comparison.
Editorial reading
Editorial: replacing the simple-average envelope with an exponentially weighted midline and a matching lookback deviation turns the familiar volatility band into a portable, platform-agnostic construction. The same envelope can then be checked as a confirmation overlay or as a breakout procedure.
NASDAQ-100 breakout: exponential bands versus Bollinger Bands
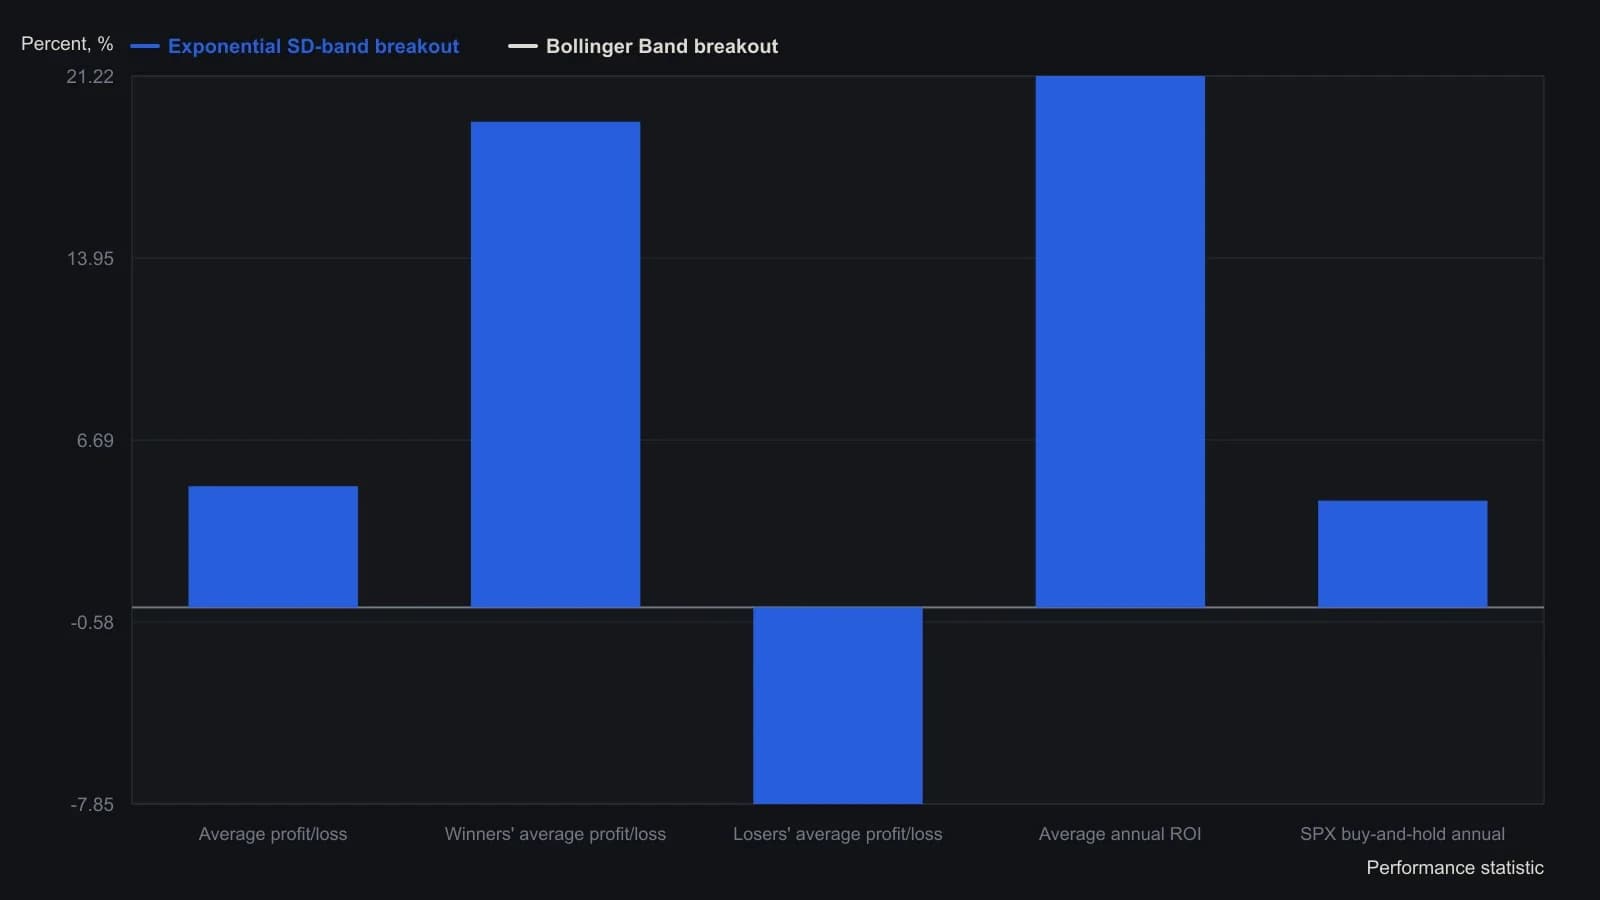
Both tests take every signal, long only, daily bars, open-to-open pricing, the NAS100 list, and include one open position. The Bollinger-band table starts 11 December 2000; the exponential-band table starts 8 December 2000; both end 9 December 2016. Trade counts (2,752 versus 4,656) are in the same tables but omitted here because they are not percentages.
All readings on this track · 23 readings
- 1995Range breakout rules with an expansion filter and moving-average exits
- 1995Write a weekly breakout as one parameterized entry and exit
- 1995Combining a trend rule, a breakout trigger, and a seasonal filter
- 1996Constructing a two-bar clearance breakout from a twenty-session exponential average
- 1996Two-bar exponential-average breakout as setup, stop, and flatten
- 1998A noise-offset breakout judged after walk-forward re-estimation
- 1998Gating a weekly average crossover with stored support and resistance
- 1998Moving-average candidates gated by support and resistance
- 2000Constructing next-close envelope targets for breakout stops
- 2001February soybean high breakout and June trailing stop
- 2005Box-and-breakout states written as ordered entry and exit rules
- 2007Match trend and breakout rules to the market condition
- 2010How a JM internal band becomes long and short entry and exit rules
- 2013Constructing a three-average trend-aligned breakout system
- 2016Volume-confirmed breakout entry rules
- 2017How to construct exponential standard deviation bands
- 2017Four-day green candle breakout as one swing procedure
- 2018Constructing inverse ETF breakouts above a 200-day average
- 2018Evaluating trend, breakout, and regression rules by average robustness
- 2019A crypto pair breakout after a sideways range
- 2019Next-session breakout rules after a high-volume close
- 2020Altcoin dual-stop breakout with a timed exit
- 2020Critiquing required stops in mechanical breakout systems