2018issue C067
Constructing inverse ETF breakouts above a 200-day average
A long-only inverse-product swing procedure can be written as one package: a 200-day simple moving average as the recovery reference, a two-point buffer that withholds the long until a buy-stop is reached, and a stop-loss plus prior-range target set before the order is placed.
- Inverse products that rise when the cash market falls use breakout entries that differ from ordinary funds because those products are more volatile.
- The long signal waits until price is at least two points above the 200-day simple moving average on a 90-day candle chart, then enters with a buy-stop at that buffered level.
- The initial stop-loss is placed at the 200-day simple moving average and the initial objective is taken from the prior range, both written before the order is placed.
- The procedure is used only when price is already advancing toward the 200-day simple moving average, not when price remains far below that line.
Inverse products and breakout entries
Inverse exchange-traded products that rise when the cash market falls are treated with breakout entries that differ from ordinary funds because those products are more volatile. A listed inverse ETF is handled here as a more volatile vehicle than ordinary funds or shares.
The construction does not take a first recovery on its own. Entry, the initial protective exit and the first objective are written together so the long is taken only after a stated clearance and only with the loss already bounded.
The 200-day moving average as the reference
On a 90-day candle chart, a 200-day simple moving average is used as the resistance and recovery reference for long entries in those products. That moving average is the line the rest of the procedure is built around.
A two-point buffer and a buy-stop
The constructed long signal waits until price is at least two points above the 200-day simple moving average instead of taking the first recovery through that line. That minimum two-point clearance is the entry buffer, and it is used to reduce first-touch recoveries that fail.
A buy-stop is placed at the buffered breakout level so the position is taken only if price actually reaches that price. In the SDS illustration, the 200-day simple moving average at 44.2 plus a two-point buffer produces a buy-stop entry at 46.20.
SDS daily closes versus the 200-day average and the two-point buy-stop
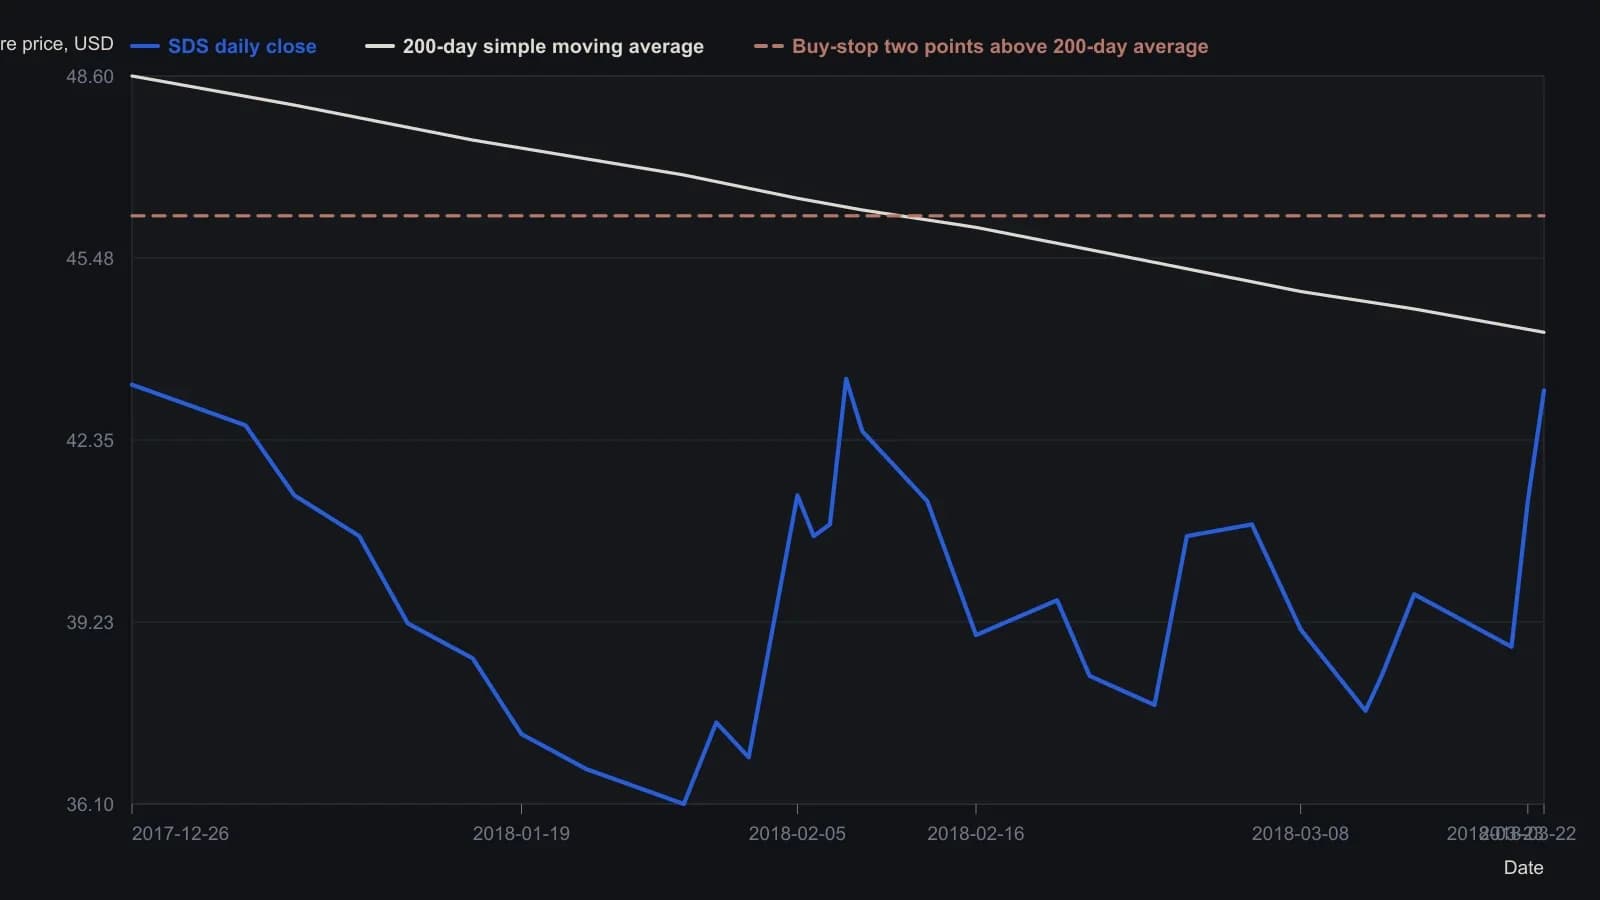
Closes are approximate to about 0.2–0.3 dollars from the candlestick pane. The right-hand 200-day value of $44.20 and the $46.20 buy-stop are taken from the text, not scaled off the raster. The February 9 upper wick reached about $45 and still failed the average; that high is not in the close series.
Stop-loss and range target written before entry
The same construction places the initial stop-loss at the 200-day simple moving average, 44.20 in the illustration. That initial protective exit sits at the moving-average reference after the buffered breakout is defined, so the loss is bounded before the position is taken.
The initial exit objective is the range target. It is taken from the prior swing range on the same 90-day chart and added to the moving-average reference used in the example. The illustration uses an approximate 9-point range added to 44.20 to give 53.20.
When the procedure is applied
The procedure is applied when price is already advancing toward the 200-day simple moving average, not when price is still far below that line.
All readings on this track · 23 readings
- 1995Range breakout rules with an expansion filter and moving-average exits
- 1995Write a weekly breakout as one parameterized entry and exit
- 1995Combining a trend rule, a breakout trigger, and a seasonal filter
- 1996Constructing a two-bar clearance breakout from a twenty-session exponential average
- 1996Two-bar exponential-average breakout as setup, stop, and flatten
- 1998A noise-offset breakout judged after walk-forward re-estimation
- 1998Gating a weekly average crossover with stored support and resistance
- 1998Moving-average candidates gated by support and resistance
- 2000Constructing next-close envelope targets for breakout stops
- 2001February soybean high breakout and June trailing stop
- 2005Box-and-breakout states written as ordered entry and exit rules
- 2007Match trend and breakout rules to the market condition
- 2010How a JM internal band becomes long and short entry and exit rules
- 2013Constructing a three-average trend-aligned breakout system
- 2016Volume-confirmed breakout entry rules
- 2017How to construct exponential standard deviation bands
- 2017Four-day green candle breakout as one swing procedure
- 2018Constructing inverse ETF breakouts above a 200-day average
- 2018Evaluating trend, breakout, and regression rules by average robustness
- 2019A crypto pair breakout after a sideways range
- 2019Next-session breakout rules after a high-volume close
- 2020Altcoin dual-stop breakout with a timed exit
- 2020Critiquing required stops in mechanical breakout systems