2013issue C1239-41
Constructing a three-average trend-aligned breakout system
A daily template assigns one exponential average to trend bias only, two short simple averages to the breakout and the trade-life stop, and a sequential gate so a later breakout cannot open inside an unstopped episode.
- Before the template is written, the logic must map to a repeating chart-visible dynamic, be followable with real capital at risk, and fit purchase, data, and upkeep costs.
- The trendBiasAverage may vote only on direction. The highRail and lowRail define the breakout threshold and the trailing stop.
- A long signal needs a prior close above the trend-bias average and a break of the prior session highRail by a scaled tickBuffer. A new entry waits until the prior episode, taken or skipped, has been stopped out.
- The finished procedure is a momentum and breakout model aimed at a candidateUniverse of liquid, high-beta names with regular swing or trend legs, not chronically narrow ranges.
Three checks before a template is written
Before a template is built, three construction checks are posed. The first is whether the logic maps to a repeating, chart-visible market dynamic. The second is whether the operator can follow the rules with real capital at risk. The third is whether purchase, data, and upkeep costs fit the account, commissions, and markets.
Three averages and their assigned jobs
The chart template uses three ordinary averages. A 50-day exponential average is the trendBiasAverage. It is a directional gate on the daily chart, not the entry trigger.
A five-day simple average of daily highs is the highRail. It sets the long breakout threshold from the prior session. A five-day simple average of daily lows is the lowRail. It sets the long-side initial and trailing stop.
Citigroup daily with three-average breakout template, Nov 2012–Feb 2013
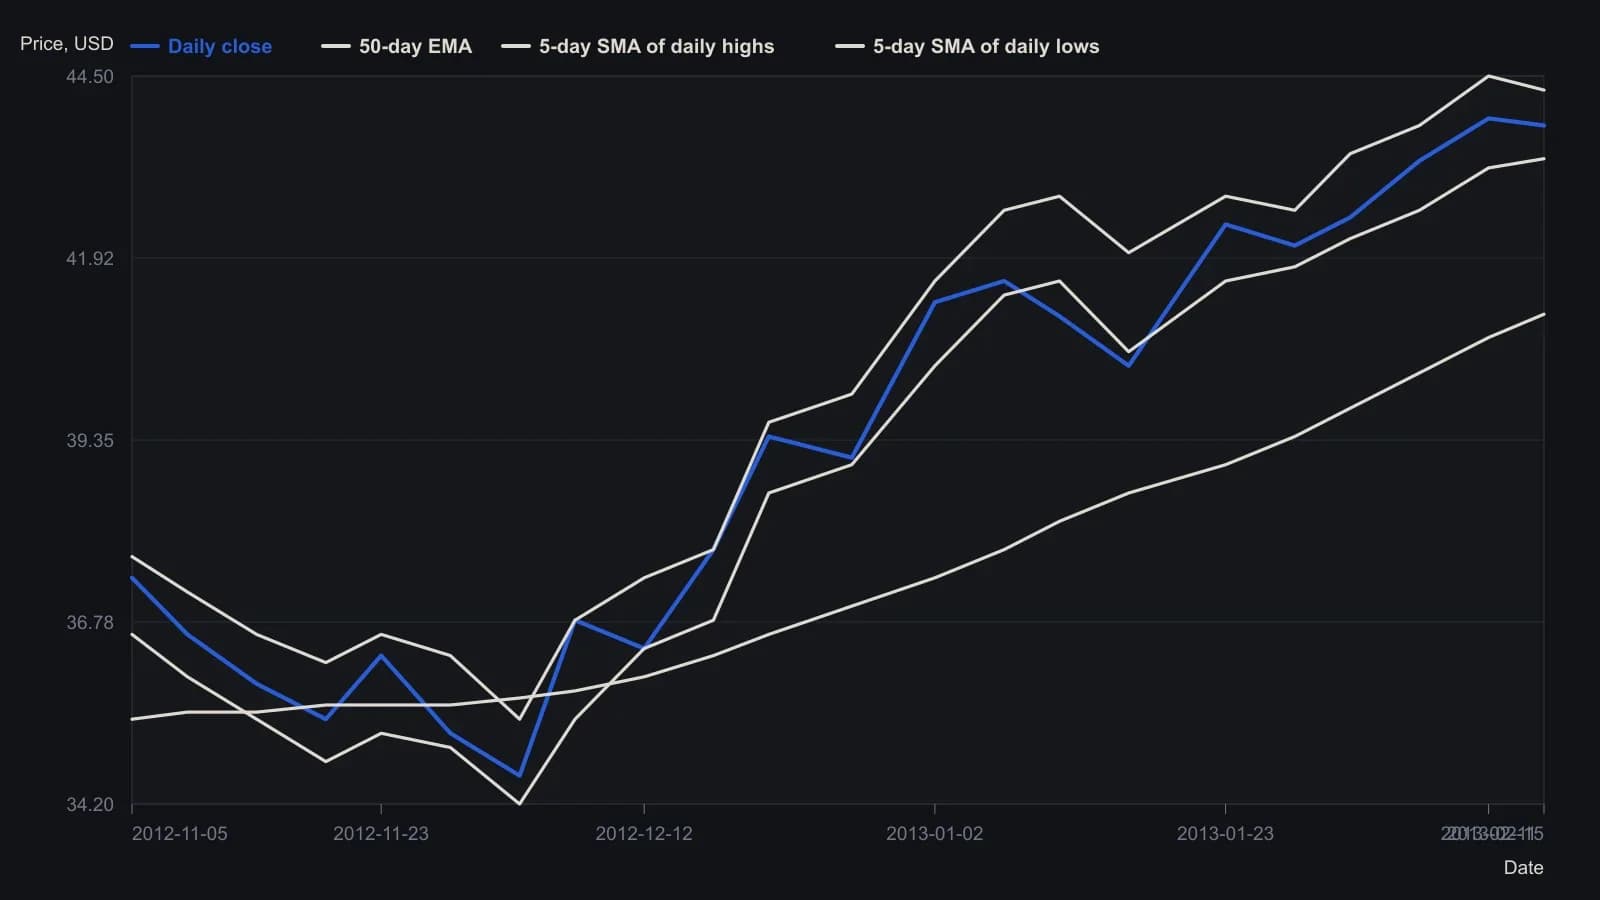
OHLC bars and the three moving-average traces were read from the published daily chart of C through 15 Feb 2013. Labeled trade prices on the figure were used as anchors; intermediate curve values are approximate. The open February long is shown at the last plotted close, not at the later 20 Feb stop of 43.84 stated in the article text.
Long entry, stop, and sequential gate
A long entry is defined only when price breaks the prior session highRail by a tickBuffer of five ticks (0.05) and the bar immediately before that break has already closed above the 50-day exponential average. The tickBuffer is a small increment beyond a rail required before a breakout is valid. It is widened or narrowed for unusually cheap or expensive instruments.
After a long entry, the prior session lowRail is the initial and trailing stop for the life of the trade. Substituting the entry bar low is noted as a more aggressive stop that can force an earlier exit.
The sequentialEntryGate withholds a new signal until the prior trade episode, taken or skipped, has been stopped out. Later breakouts of an unstopped signal are not stacked. Short-side construction is the inverse of the long-side rules. All three entry conditions must be true before a signal is taken.
Candidate filter and finished model
Candidate selection is part of construction. The candidateUniverse keeps liquid, high-beta issues that historically produce regular swing or trend legs, and it drops chronically narrow, range-bound names. One stated liquidity screen is one million shares of average daily volume over the prior 50 sessions.
The finished model is a momentum and breakout procedure that enters only with the intermediate-term daily trend defined by the 50-day exponential average. It accepts mid-swing participation rather than exact highs and lows.
Explicit construction variants include shortening the trendBiasAverage to 21 or 30 days to raise signal frequency, lengthening it to 80 or 100 days to slow it, or changing the highRail and lowRail lengths to the same effect.
All readings on this track · 23 readings
- 1995Range breakout rules with an expansion filter and moving-average exits
- 1995Write a weekly breakout as one parameterized entry and exit
- 1995Combining a trend rule, a breakout trigger, and a seasonal filter
- 1996Constructing a two-bar clearance breakout from a twenty-session exponential average
- 1996Two-bar exponential-average breakout as setup, stop, and flatten
- 1998A noise-offset breakout judged after walk-forward re-estimation
- 1998Gating a weekly average crossover with stored support and resistance
- 1998Moving-average candidates gated by support and resistance
- 2000Constructing next-close envelope targets for breakout stops
- 2001February soybean high breakout and June trailing stop
- 2005Box-and-breakout states written as ordered entry and exit rules
- 2007Match trend and breakout rules to the market condition
- 2010How a JM internal band becomes long and short entry and exit rules
- 2013Constructing a three-average trend-aligned breakout system
- 2016Volume-confirmed breakout entry rules
- 2017How to construct exponential standard deviation bands
- 2017Four-day green candle breakout as one swing procedure
- 2018Constructing inverse ETF breakouts above a 200-day average
- 2018Evaluating trend, breakout, and regression rules by average robustness
- 2019A crypto pair breakout after a sideways range
- 2019Next-session breakout rules after a high-volume close
- 2020Altcoin dual-stop breakout with a timed exit
- 2020Critiquing required stops in mechanical breakout systems