2003issue C101-3
Three ratio tests from a completed supercycle
A DJIA chart as of 16 April 2002 labeled a completed five-wave supercycle from the 1932 low to the January 2000 high. Three constants taken from earlier cycle corrections were then applied only to cycle V, each as its own projected level.
- The April 2002 DJIA chart treated the 1932 low to the January 2000 high as a completed five-wave supercycle, with cycle-degree waves 1 through 5 overlaid.
- Cycles I, III, and V were each counted as five primary-degree waves on an idealized map that used theoretical highs and lows.
- A 1.207 constant and a 1.08 multiple, each taken from earlier cycle corrections, were applied only to cycle V and projected 2275 and 1745.
- A third test multiplied cycle V wave-2 and wave-4 correction factors to 2.38 and divided 11908 by that product, projecting 5003.
A labeled supercycle
A DJIA chart as of 16 April 2002 labeled a completed five-wave supercycle from the 1932 low to the January 2000 high, with cycle-degree waves 1 through 5 overlaid. The supercycle is the largest completed five-wave structure examined here.
In that count, waves 1, 3, and 5 advanced with the supercycle trend and waves 2 and 4 corrected the prior advances. A correction of the entire five-wave sequence was expected after wave 5.
The completed supercycle spanned 68 years ending in January 2000. It was treated as the first such structure that could be measured with theoretical daily extremes back to its start.
Counting at the next smaller degree
Elliott wave analysis organizes a larger trend as five waves with that trend and three waves against it. Those legs can be counted again at the next smaller degree. Cycles I, III, and V were each counted as five primary-degree waves.
Wave counting labels impulse and corrective legs across degrees so later ratio arithmetic is applied to a consistent map of highs and lows.
An idealized map used theoretical DJIA highs and lows because official print extremes were not recorded until the 1970s. A theoretical extreme is an estimated index high or low that assumes all constituents printed their daily extremes at the same moment.
A shared 1.207 constant
The cycle I primary wave-3 top of 111.93 divided by the cycle II low of 92.69 equals 1.207, matching the cycle III primary wave-3 top of 688.21 divided by the cycle IV low of 570 to three decimal places.
Applying that 1.207 constant to cycle V’s primary wave-3 top of 2746.65 produced a projected level of 2275 for a correction of the cycle V advance that began in 1974 at 570.
Fibonacci retracement, as used here, estimates how far a correction may travel relative to a prior advance by reusing a constant taken from earlier, analogous swings.
A reused 1.08 multiple
Cycle II and cycle IV lows were each 1.08 times the preceding primary wave-4 lows. Applying 1.08 to cycle V’s primary wave-4 low of 1616.21 produced 1745.
A product of correction factors
A correction factor is the ratio of a declining wave’s starting price to its ending price, used to compare the depth of one correction with another.
In earlier cycles, the product of wave-2 and wave-4 correction factors nearly matched the next cycle-degree decline factor (2.13 versus 2.11; 1.743 versus 1.756). For cycle V, 1.40 times 1.70 equals 2.38, and 11908 divided by 2.38 equals 5003.
Three levels, three hypotheses
Editorial view: 2275, 1745, and 5003 each rest on a different transferred constant applied only to cycle V. One level can fail without forcing the other tests, or the underlying wave count, to be redrawn.
Three DJIA downside targets from cycle-V ratio tests
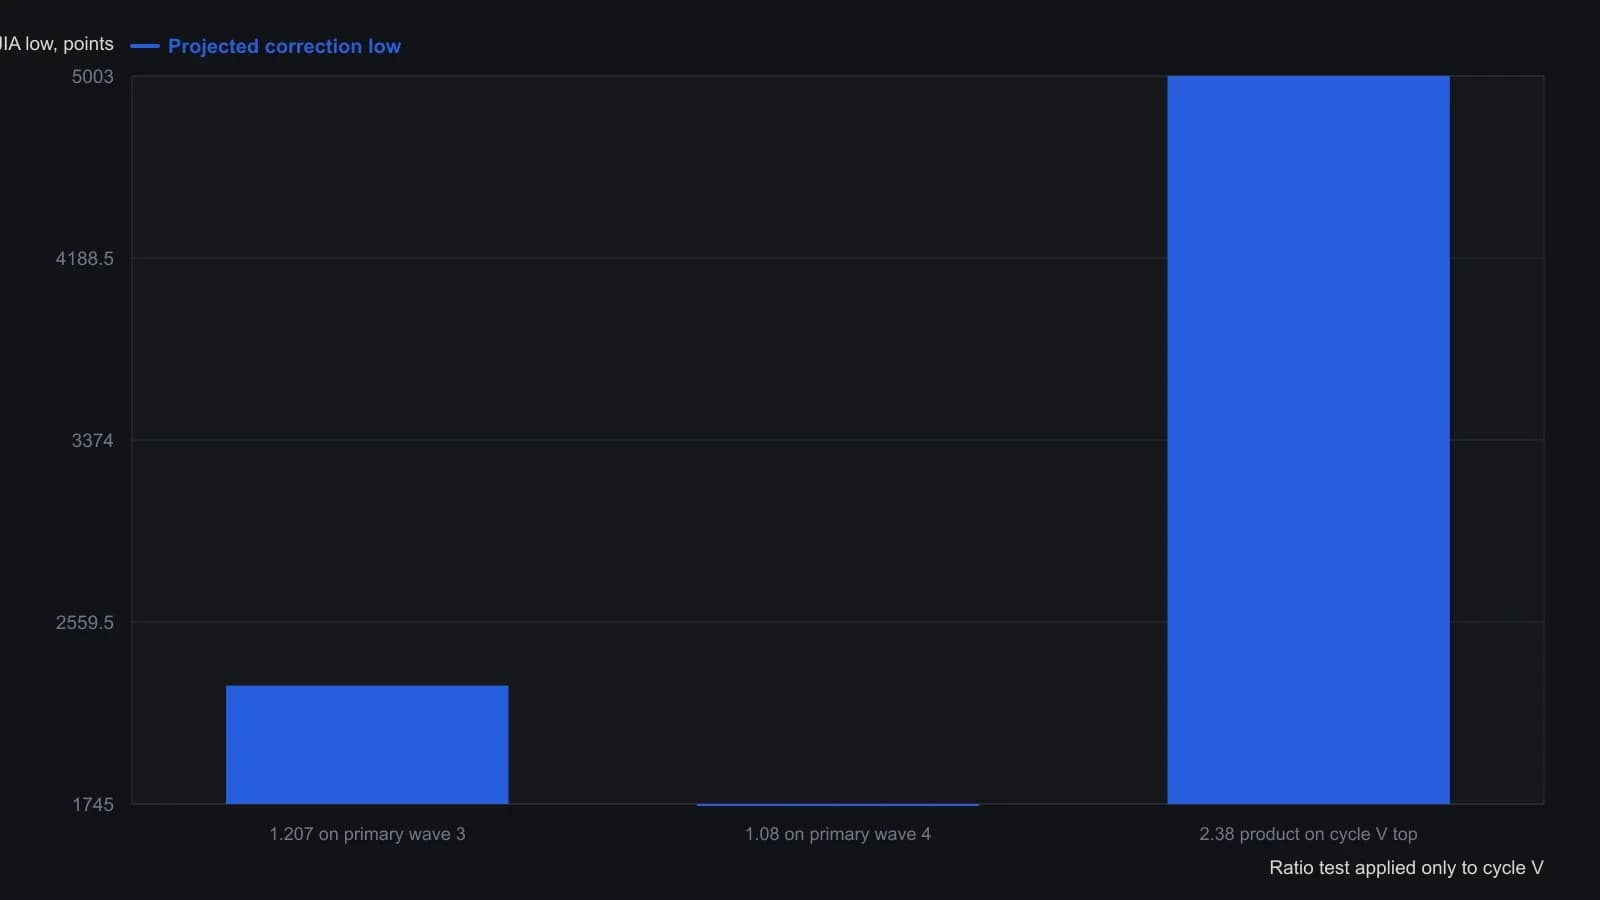
Theoretical DJIA values are used because official print highs and lows were not recorded until the 1970s. Cycle V is measured from the 1974 low at 570; Morgan notes a supercycle-degree decline from 1932 could run even deeper than these cycle-V projections.
All readings on this track · 16 readings
- 1991Wave counting as a sampling frame for head and shoulders
- 1995Constructing a percent-reversal wave filter
- 1995Filtered waves, overdue duration, candles, and trend
- 1995Filtered swing ledger for MW pattern construction
- 2003Three ratio tests from a completed supercycle
- 2004Wave labels as a checklist for expansion versus contraction
- 2010Constructing wave-ratio signals from a quadratic trend filter
- 2011A temporary placeholder while source evidence is loaded
- 2011Construct a harmonic impulse from measured three-wave limbs
- 2012Three Fibonacci rules to label trend versus countertrend
- 2013Sentiment wave counts before news headlines
- 2013Constructing a 1-2-3 wave count from high-low zigzag swings
- 2013Step candle confirmations with wave count and chandelier exit
- 2016Nested wave rhythms and double-bottom support
- 2016Nested correction-size bands and a derived support price
- 2020Counting a Nasdaq correction before stacking Fibonacci targets