2014issue C0453-56
Volume-backed support and resistance construction
A 2014 reconstruction locates supply-demand pools with relative volume and Freedom of Movement, then turns selected extremes into horizontal defended price lines that later bars can confirm or break.
- Support and resistance are reconstructed by locating supply-demand pools with two volume-based studies: relative volume and Freedom of Movement.
- Relative volume standardizes current volume against its mean and spread over a lookback window. Freedom of Movement rescales that reading against the concurrent price change, then standardizes the ratio.
- A standard-deviation trigger of two or more standard deviations is only a heuristic start for defended price lines. A cluster filter then keeps the most influential levels.
- Editorial reading: isolate unusual volume or movement-efficiency events first, then promote only the most clustered events into explicit price lines.
Locating supply and demand pools
The April 2014 Traders' Tips package reconstructs support and resistance by locating supply and demand pools with two volume-based studies: a relative-volume indicator and Freedom of Movement. Relative volume is a standardized volume reading that compares current volume with its recent mean and spread so unusually large or small participation stands out from typical activity. Freedom of movement is a constructed oscillator that rescales relative volume against the size of the concurrent price change, then standardizes that ratio so unusually inefficient or efficient movement can be marked.
Building the relative-volume reading
Relative volume is constructed as current volume minus its simple moving average, divided by the standard deviation of volume over the same lookback, then optionally clipped so only readings above a chosen deviation count or only non-negative values remain for a two-color histogram. Typical formula inputs in the supplied implementations let the lookback window run from 5 to 120 bars with a default of 60, and let the deviation threshold run from 0 to 4 with a default of 2. Keeping only the non-negative portion of the plot is a histogram split, a two-color convention that leaves extreme events visible without a continuous line cluttering the pane.
Building the freedom-of-movement oscillator
Freedom of Movement first standardizes the absolute one-bar close-to-close percent change and the relative-volume series each onto a 1-to-10 range over the lookback window, divides the volume score by the move score, then standardizes that ratio against its own mean and standard deviation. When the high-minus-low range of the move or volume series is zero, the supplied MetaStock construction substitutes a denominator of -1 before taking the absolute value so the rescaling step does not divide by zero.
Adobe relative volume versus the two-sigma guide
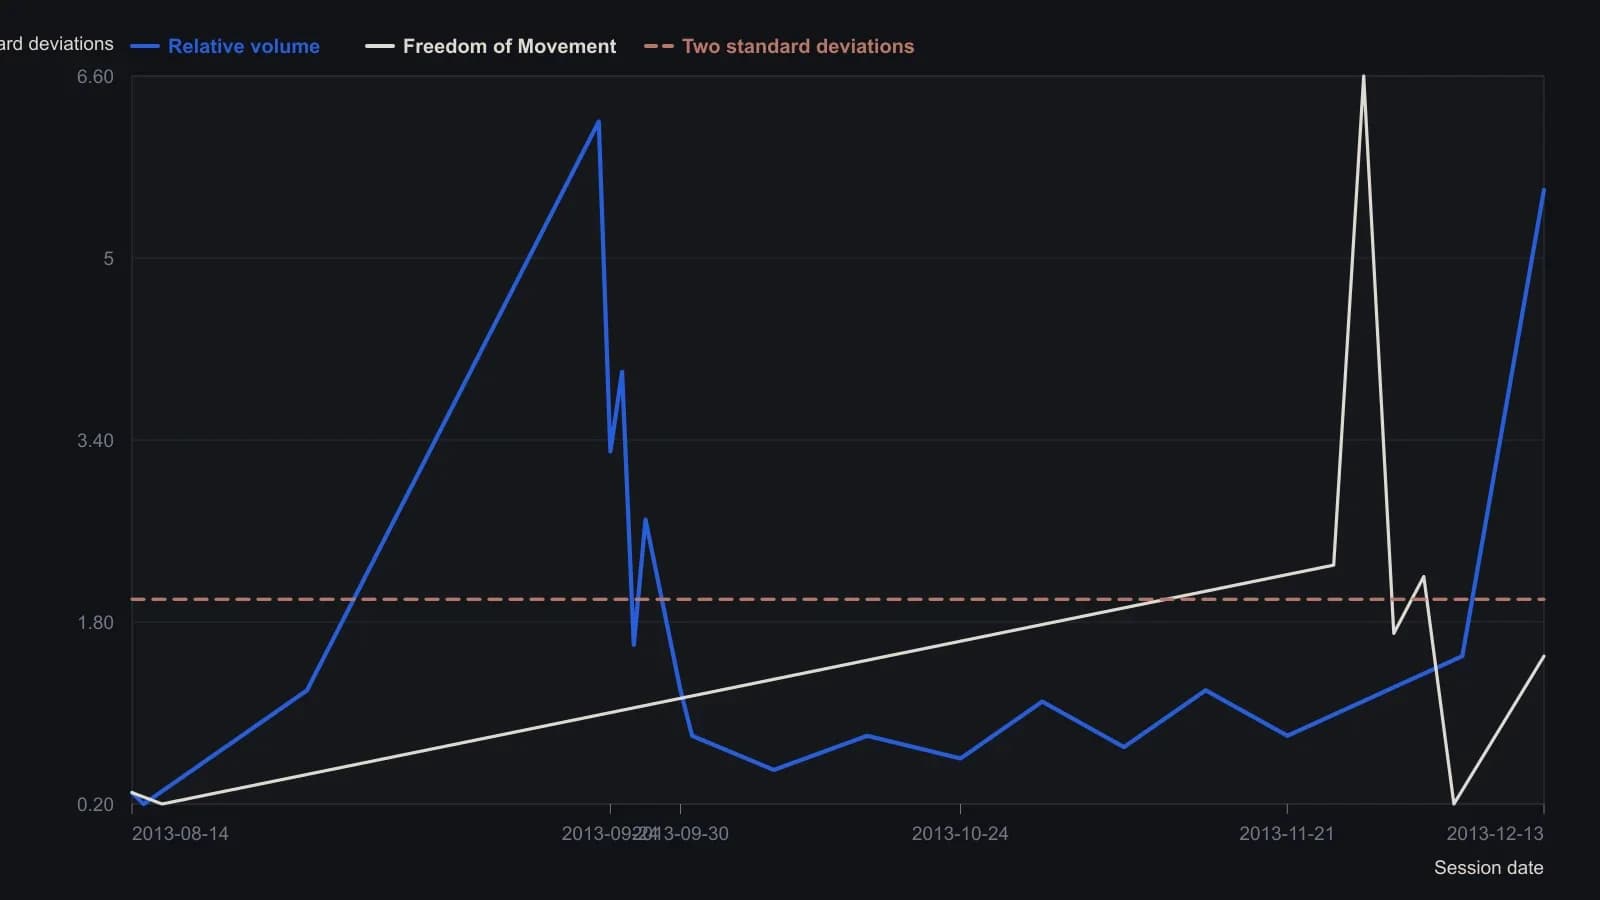
Dickover's formulas use a 60-session mean and standard deviation and a default cutoff of two sigmas, and they plot only positive readings, so quiet sessions sit at zero. Dates for the smaller October–November ticks are placed from the S/O/N/D axis and are only good to a few days.
Placing and thinning defended price lines
A starter algorithm for drawing defended price lines places a horizontal level wherever relative volume or Freedom of Movement jumps two or more standard deviations from its mean. That standard-deviation trigger is described as heuristic and only a starting point. Each kept level is a defended price line: a horizontal price level placed where an extreme relative-volume or freedom-of-movement event is taken as evidence of a supply or demand pool. A supply-demand pool is the inferred concentration of resting orders that this volume-backed construction treats as the reason a later support or resistance test may hold or fail.
To avoid a crowded field of candidate lines, the construction is refined by keeping the most influential levels according to clustering, strong momentum, and high volume. The cluster filter is that discretionary refinement. It keeps only the most influential candidate lines instead of plotting every threshold crossing.
Same construction on more than one platform
Multiple charting platforms published parallel reconstructions of the same two indicators, including EasyLanguage, MetaStock formulas, thinkScript studies, a Wealth-Lab library pair, TradersStudio and AIQ scripts, and NinjaTrader imports, so the construction can be replicated independently of any one vendor. Sample daily charts used to illustrate the construction include Archer-Daniels Midland with both indicators in lower panes and Alaska Air with Freedom of Movement and relative volume overlaid as colored studies.
All readings on this track · 12 readings
- 1989A daily checklist that separates the screen from the entry
- 2002Prior-week high and low as this week's support and resistance
- 2004A daily veto that left only a two-point afternoon short
- 2005A real-time audit after overriding a moving-average filter
- 2006Discretionary rules before leverage in forex
- 2008Flipped support and resistance as target zones
- 2011When expected chart setups fail, trade the pop
- 2012A mechanical rule set from the gold positioning reports
- 2014Volume-backed support and resistance construction
- 2015SMA-confirmed supply and demand breakouts as one mechanical procedure
- 2016Trade within your league as one decision process
- 2018Building a pre-trade checklist with stops and levels