2005issue C021-2
A real-time audit after overriding a moving-average filter
A written moving-average filter allowed only long trades while the index stood well above its 50-day average, yet a short was opened from a five-minute support-resistance break. This piece restates that rule-override as a design problem: write the ignored filter, turn the break into a testable rule, and replay the same session as a real-time indicator audit.
- The written mechanical trading system allowed only long trades while the index stood well above its 50-day moving average.
- A short was still opened around 11:55 from a five-minute support-resistance break, with resistance near 1184, support near 1182, and a fill at 1182.00.
- An exit near 1180 was postponed after attention lapsed, and the position was closed at 12:55 near 1179 after selling interest increased again.
- A real-time indicator audit asks whether a candidate measure would have marked entry and a timely exit on that same sequence, because trading procedures have to be revised as market behavior changes.
The ignored moving-average filter
The written mechanical trading system allowed only long trades while the index stood well above its 50-day moving average. That moving-average filter used a lookback average of ordered prices as a directional forecast and as a gate before a trade was allowed.
Under those rule inputs and that market state, the procedure did not license a short. Opening a short anyway is a rule-override: a position that contradicts the system's written directional filter.
S&P 500 versus its 50-day moving average, May–December 2004
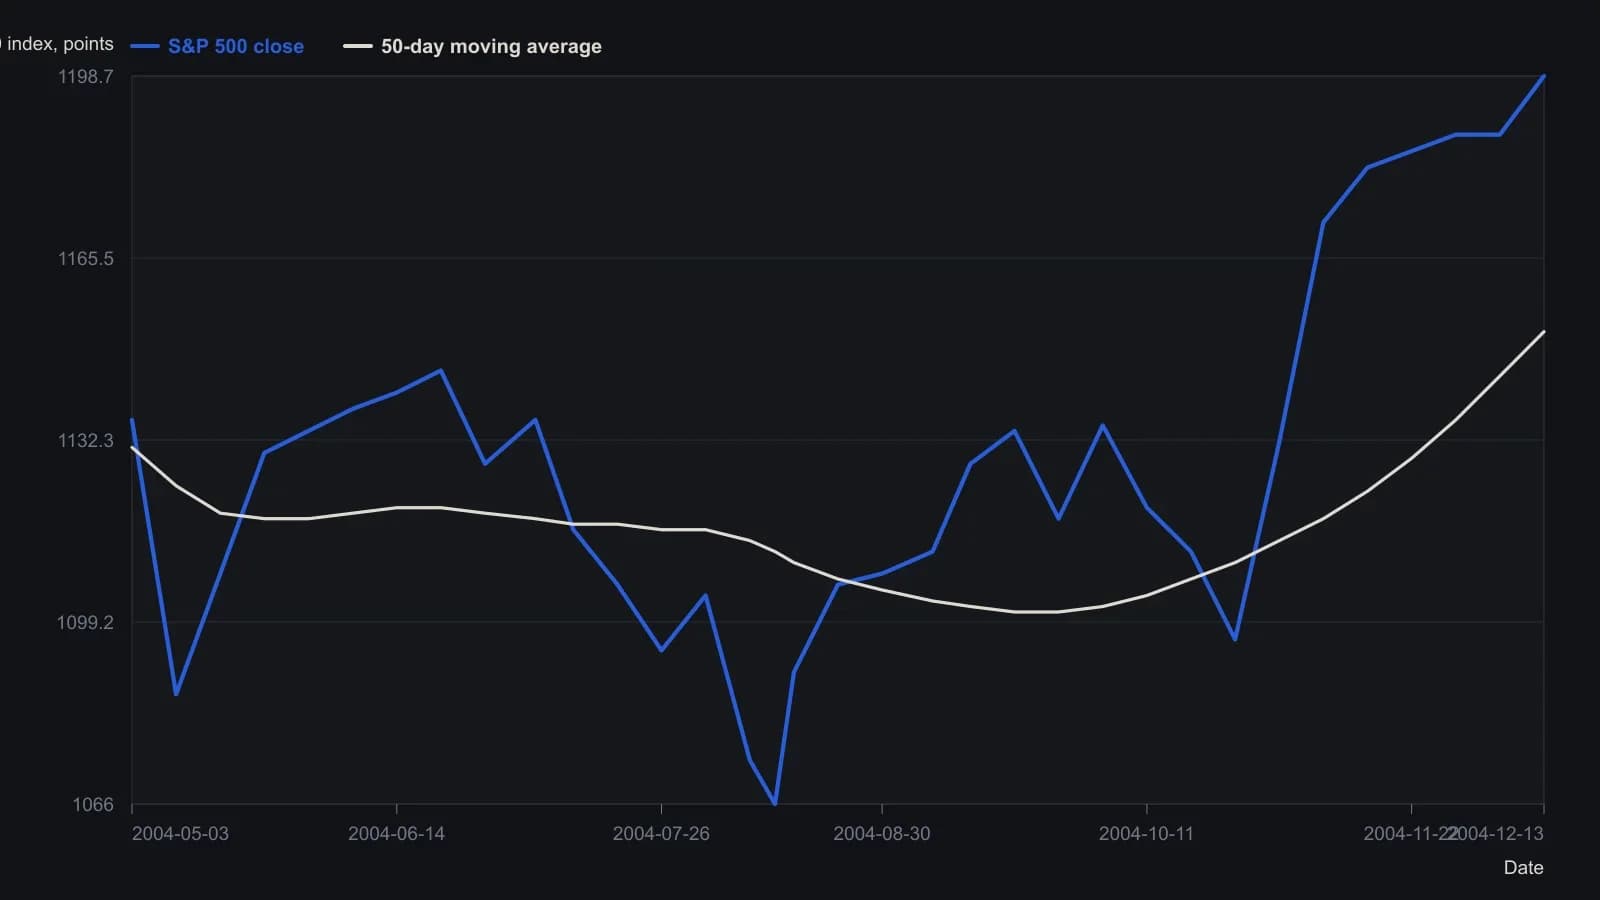
Intermediate closes and the moving-average path are digitized from the daily candles and blue average line. Precision is limited to whole index points except for the labeled 13 December close (1198.68) and the last printed average (1152.08). The yellow circle on the source plot marks the December cluster well above the average.
The support-resistance break that licensed the short
A short was opened anyway after a five-minute chart showed a downward push with resistance near 1184 and support near 1182. Resistance, on the chart in use, is a price area where prior selling repeatedly interrupted an advance. Support is a price area where prior buying repeatedly interrupted a decline.
The short was taken around 11:55 when price looked ready to break the 1182 support area, and the fill was 1182.00. That chart condition is a support-resistance break: price looks ready to leave a defined support area after failing under nearby resistance.
Attention, hold, and exit
An exit near 1180 was considered and postponed after attention lapsed. The position was closed at 12:55 near 1179 after selling interest increased again.
Crowd participation was inferred from watching price and volume. Judging how long the move would last was treated as a technical-analysis problem rather than a completed system signal.
A real-time indicator audit
A live intraday move is presented as the moment to attach an indicator and ask whether it would have marked an entry and a reasonable exit. That check is a real-time indicator audit: attaching a candidate measure to a live bar sequence to ask whether it would have signaled entry and a timely exit.
If a sharp drop within a minute is not reflected by the chosen indicators, other measures should be compared, because a useful fit need not persist across market types.
Revise procedures as behavior changes
The closing lesson is that trading procedures have to be revised as market behavior changes rather than assumed to keep working. Editorial note: a mechanical trading system stays one procedure only while its enter, exit, and stand-aside rules stay aligned with the market state they were written for.
All readings on this track · 12 readings
- 1989A daily checklist that separates the screen from the entry
- 2002Prior-week high and low as this week's support and resistance
- 2004A daily veto that left only a two-point afternoon short
- 2005A real-time audit after overriding a moving-average filter
- 2006Discretionary rules before leverage in forex
- 2008Flipped support and resistance as target zones
- 2011When expected chart setups fail, trade the pop
- 2012A mechanical rule set from the gold positioning reports
- 2014Volume-backed support and resistance construction
- 2015SMA-confirmed supply and demand breakouts as one mechanical procedure
- 2016Trade within your league as one decision process
- 2018Building a pre-trade checklist with stops and levels