2002issue C091-6
Prior-week high and low as this week's support and resistance
The immediately completed week's high and low can be projected as two forward horizontals and held constant through the new week. Editorial reading: treat that pair as a frozen weekly frame and score every hold or break against levels that stay fixed until the next week-boundary.
- Project last week's completed high and low as two forward horizontals and hold them constant through the new week.
- Detect a week-boundary when the weekday index falls below the prior bar, then lock the stored extremes and reset the running high and low.
- Mark a close above the prior-week-high as an upside break of constructed resistance and a close below the prior-week-low as a downside break of constructed support.
- The same prior-period construction works on other scales, including previous-day extremes on an intraday series and a mixed-periodicity-overlay of weekly bands on daily bars.
A standing weekly pair
The immediately completed week's high and low can serve as support and resistance for the new week. In this construction, support-resistance means horizontal prices taken from a completed higher-timeframe range and projected onto the active chart as levels the current series can hold or break.
The prior-week-high is the highest price of the immediately completed week, held constant through the new week. The prior-week-low is the lowest price of the immediately completed week, held constant through the new week.
How the two horizontals are built
Construction begins by projecting two forward horizontals, one from last week's high and one from last week's low. On daily bars, each completed week leaves two horizontals at that week's high and low. The active week's pair extends to the right while the running high and low are stored for the next pair.
Last week's high is the highest high since the previous week-start, read at the new week-start. Last week's low is the matching lowest low.
Current-week high is a running maximum from the first weekday, and previous-week high is that value taken on the next first weekday and held. Current-week low and previous-week low use the same first-weekday hold with a running minimum.
Where the week-boundary is read
A week-boundary is the first bar whose weekday index is lower than the prior bar's, marking the start of a new weekly range. A new week can be detected when the weekday index is lower than on the prior bar. At that boundary the stored weekly high and low become the plotted levels and tracking resets to the new bar's high and low.
How the levels stay visible on daily bars
Weekly-scale high and low series can be shifted by one week and converted back to daily bars so last week's extremes plot as constant levels through the current week. Weekly high and low can be overlaid as bands on a daily chart by mixing weekly periodicity into the daily series and pointing the upper band at last week's high and the lower band at last week's low.
A mixed-periodicity-overlay plots weekly extremes on a daily or intraday series so the higher-timeframe range is visible on every lower-timeframe bar.
How a hold or break is marked
A daily close crossing above last week's high can be marked as an upside break of constructed resistance. A close crossing below last week's low can be marked as a downside break of constructed support.
The same prior-period extremes can be built on other scales: previous-day high and low on an intraday series, previous-week high and low on a daily series, or both day and week levels stacked on one multi-timeframe chart.
Prior-week high and low on Electronic Arts (ERTS)
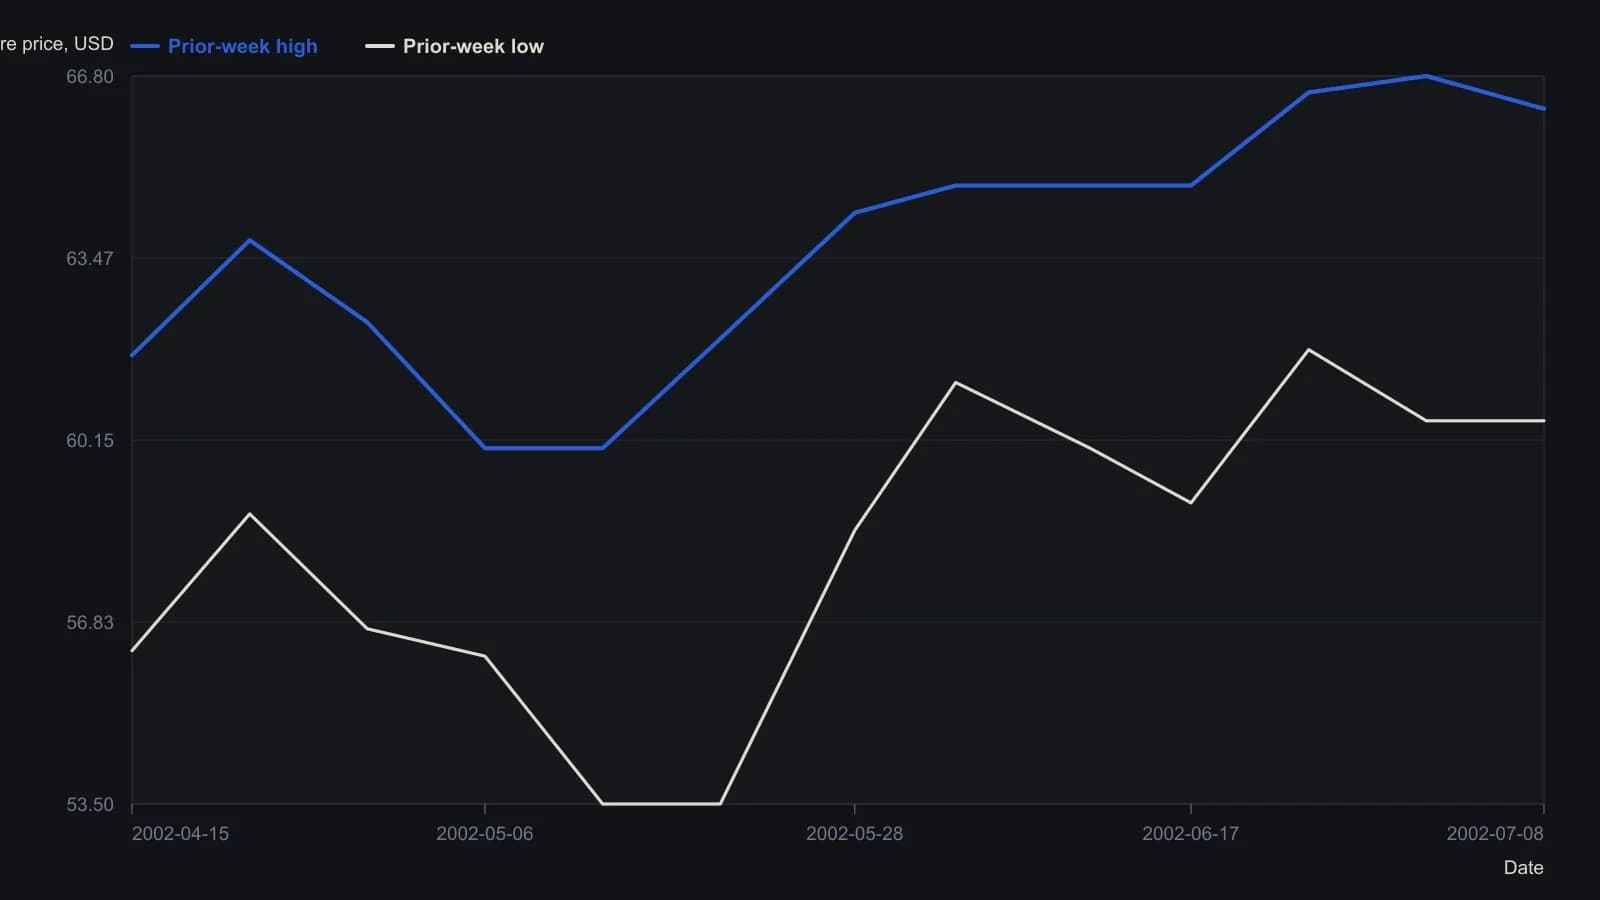
Y-values are raster readings off a one-dollar grid, so they are approximate to about $0.3. Consecutive equal readings are weeks in which the frozen frame did not step. The $63.80 last print is exact.
All readings on this track · 12 readings
- 1989A daily checklist that separates the screen from the entry
- 2002Prior-week high and low as this week's support and resistance
- 2004A daily veto that left only a two-point afternoon short
- 2005A real-time audit after overriding a moving-average filter
- 2006Discretionary rules before leverage in forex
- 2008Flipped support and resistance as target zones
- 2011When expected chart setups fail, trade the pop
- 2012A mechanical rule set from the gold positioning reports
- 2014Volume-backed support and resistance construction
- 2015SMA-confirmed supply and demand breakouts as one mechanical procedure
- 2016Trade within your league as one decision process
- 2018Building a pre-trade checklist with stops and levels