2004issue C081-5
Listed volatility futures as a portfolio volatility hedge
A listed volatility-index futures market was introduced so holders of diversified stock books could hedge volatility and market-stress risk. This case study maps implied-volatility and historical-volatility climates first, then treats a modest long-volatility sleeve as one rules-based overlay.
- Listed volatility-index futures were introduced so diversified equity books could hedge volatility and event-risk, not only speculate on options.
- The older volatility gauge has occupied many multi-year ranges, so a single fixed level cannot serve as a buy or sell signal.
- A long volatility-futures overlay is dynamic because it can pay when implied volatility jumps, regardless of where the cash index sits.
- In an event shock, historical volatility of the cash index expands more slowly than implied volatility, so hedge size follows the current volatility-regime.
Why listed volatility futures exist
A listed volatility-index futures market was introduced so holders of diversified stock books could hedge volatility and market-stress risk rather than only speculate on options. The cash-settled listed contracts are written on a scaled volatility index. They can express a view on volatility or hedge an equity book.
How the listed contract is sized
The listed contract is sized on a jumbo volatility index equal to ten times the headline volatility index. A one-point move in the headline index is worth one thousand dollars per futures contract.
Read the volatility-regime first
Long-run history of the older volatility gauge shows it occupying many different ranges, so a single fixed level cannot serve as a buy or sell signal. Distinct multi-year climates appear in that history. Frequent readings above 20 with large spikes mark 1986-90. A quieter 1991-95 stretch printed lows below 10. Persistently elevated readings averaging near 30 run from 1997 into the first half of 2003.
A later bull-market phase beginning in March 2003 produced a steep decline in that older volatility gauge to levels not seen in eight years, showing that the hedge overlay must adapt when the volatility climate changes.
VXO implied-volatility climate, 1986–2003
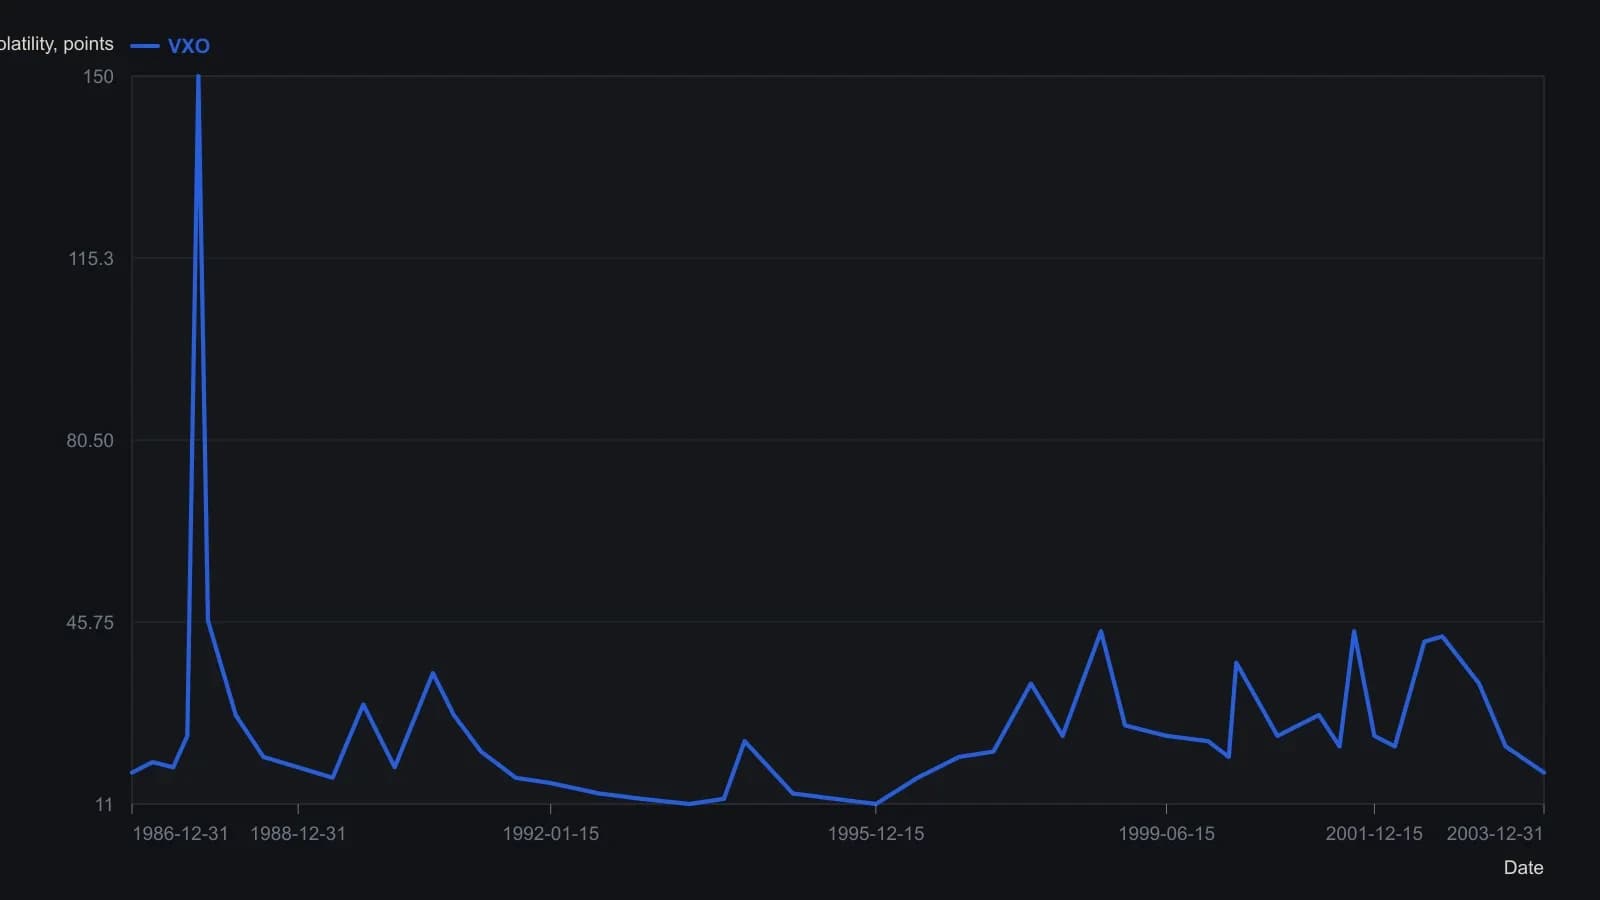
The published figure draws a 0–80 vertical scale; the 1987 crash is annotated at 150 and that stated print is used here rather than the clipped spike height. Other readings are approximate turning points off the curve, not official daily settlements.
A long-volatility sleeve as one procedure
Unlike a static index-put hedge, a long volatility-futures overlay is described as dynamic because it can pay when implied volatility jumps, regardless of where the cash index sits at that moment. The hedging-strategy here is a rules-based long-volatility overlay that sizes futures against equity exposure so event-risk and market-stress losses are offset without requiring a market-direction call.
If a large premium on longer-dated futures persisted, a 10 percent volatility overlay was estimated to cost the overall book about 3 percent over seven months, or 5.6 percent on an annualized basis.
Implied volatility and historical volatility in a shock
Implied-volatility is the option-market estimate of future index variability used to construct the volatility index that underpins the listed futures. Historical-volatility is realized price variability measured over a trailing window, used here to contrast how slowly actual index movement expands versus how quickly implied volatility can spike.
Realized fifty-day historical volatility of the cash index rose only to about 25 around September 2001 while the implied-volatility index shot to 44. The contrast illustrates that historical volatility expands more slowly than implied volatility in an event shock.
Over a four-year window the twenty-day historical volatility of the implied-volatility index itself ranged from 50 percent to 130 percent, so options on that index would be expected to price as expensive instruments if listed.
Editorial reading
Editorial interpretation: treat listed volatility futures as a regime-aware overlay. First map implied-volatility and historical-volatility ranges so a hedge is sized to the current climate rather than a fixed index level. Then treat a modest long-volatility sleeve as one procedure that can absorb event-driven drawdowns without converting the book into a directional short. This reading is editorial and is not attributed to the archive.
All readings on this track · 23 readings
- 1982Basis-managed hedges and related market substitutes
- 1990Options as insurance unless the process is complete
- 1996A price-weighted technology index as a hedge and sector proxy
- 2002Single-stock futures as a month, margin, and hedge overlay
- 2004Listed volatility futures as a portfolio volatility hedge
- 2006Customized commodity hedges for bond and equity portfolios
- 2007Use of capital for overnight pairs and hedge layers
- 2007Opening auctions, limit envelopes, and overnight hedges
- 2008A two-gate intermarket test for equity bear hedges
- 2010Gold futures after a large setback: cluster risk and hedge timing
- 2011Partial commodity hedges, seasonal timing, and option income
- 2011Commodity-linked shares are a wrapper, a performance-bond, and a hedge-design problem
- 2012Hedging an open bull vertical
- 2012Construct a two-pair and three-pair hedge rule book
- 2014Equity and SPY stress pairs with a scaled index hedge
- 2015Yearly at-the-money covered calls on a dividend basket
- 2015Pair hedge to hold a valid idea through noise
- 2015Unused peer hedge after an ATR-qualified pair entry
- 2016Continuous index hedges fail the annual cost test
- 2016A VIX overlay as three stacked constraints
- 2018Late-cycle index overlay to keep equity dividends
- 2019Treat a bear-market hedge as a regime switch
- 2019Hedged pairs as game-theory payoffs