1996issue C081-12
A price-weighted technology index as a hedge and sector proxy
A price-weighted technology basket can be rebuilt with an equal share count and used as a sector index-proxy. Long-sample ties to broad market proxies can hide yearly correlation breakdowns, while a small high-capitalization subset can still track the sector closely enough to leave mainly stock-specific residual risk.
- A price-weighted technology index of 100 listed and over-the-counter names can be duplicated by holding an equal number of shares after adjustments for splits and stock dividends of at least 10% of issue value.
- Relative-return correlations with the S&P 500 and the NYSE Composite were 0.827 and 0.823 over long samples, yet annual correlation with the NYSE Composite ranged from 0.225 in 1995 to 0.941 in 1987.
- Prices of the top 10 capitalized components correlated with the index at 0.991, and the top 20 at 0.994, so a small subset can stand in for the sector closely enough to isolate leftover name-specific residual risk.
- The evaluation judged the technology index a closer hedge for technology-sector risk than those broad market proxies, while prices of other technology indices tracked only fairly and relative returns tracked them poorly.
A reconstructible price-weighted basket
The 1982 Pacific Stock Exchange Technology Index was a price-weighted index: the cumulative value of one share of each of 100 listed and over-the-counter names. After adjustments for splits and stock dividends of at least 10% of issue value, holding an equal number of shares of each component could duplicate the basket.
Used that way, the series is an index-proxy, a reconstructible stand-in for a broader technology sector so a single position can be judged against diversified or regime-aware context.
As of 6 September 1995 the basket spanned 15 industries. Data communications was the largest industry weight at 14.4%, electronic equipment the smallest at 1.5%, and the average industry weight was 6.7%. Xerox was the largest single name at 2.99%.
Long-sample ties and yearly breakdowns
Correlation-analysis measures how closely relative returns or prices of two series move together, including how that relationship changes across calendar windows. Relative-return is annualized return above the contemporaneous average three-month Treasury bill yield, used to compare investments after a risk-free baseline.
Relative-return correlations of the technology index with the S&P 500 from March 1986 to January 1996 and with the NYSE Composite from September 1982 to January 1996 were 0.827 and 0.823. Annual correlations with the NYSE Composite ranged from 0.225 in 1995 to 0.941 in 1987.
From 1991 onward the technology index's average relative return was 19.50% per annum, compared with 7.70% for the S&P 500 and 7.62% for the NYSE Composite.
Price charts for 1995 to early 1996 show the three indices trending together over long horizons while the technology index can diverge over shorter windows, including a fourth-quarter 1995 trading range after an early-1995 advance.
How closely a small subset tracks the index
For January 1986 to January 1996, prices of the top 10 capitalized components correlated with the index at 0.991. The standard error was 5.36, or 5.7% of average index value, and the average weight was 1.97.
The top 20 correlated at 0.994. The standard error was 4.86, or 5.2% of average index value, and the average weight was 2.10. Fifteen of those 20 names were above 0.90, and Hewlett-Packard was the single highest at 0.965.
The same evaluation concluded that as few as 10 well-chosen stocks can correlate very highly with the index.
Sector hedge, residual drift, and leftover risk
The evaluation judged the technology index a closer hedge for technology-sector risk than the S&P 500 or the NYSE Composite. It also noted that prices tracked other technology indices only fairly and that relative returns tracked them poorly, with few observations on three of those series.
The evaluation also concluded that residual standard-error drift versus subindices is a candidate spread, and that long individual names judged cheap can be paired with a sector hedge. That pairing is a hedging-strategy: a rule-based use of an index or small stock subset to offset sector exposure while leaving room for stock-specific or residual drift.
How a small stepwise basket tracks the PSE Technology Index
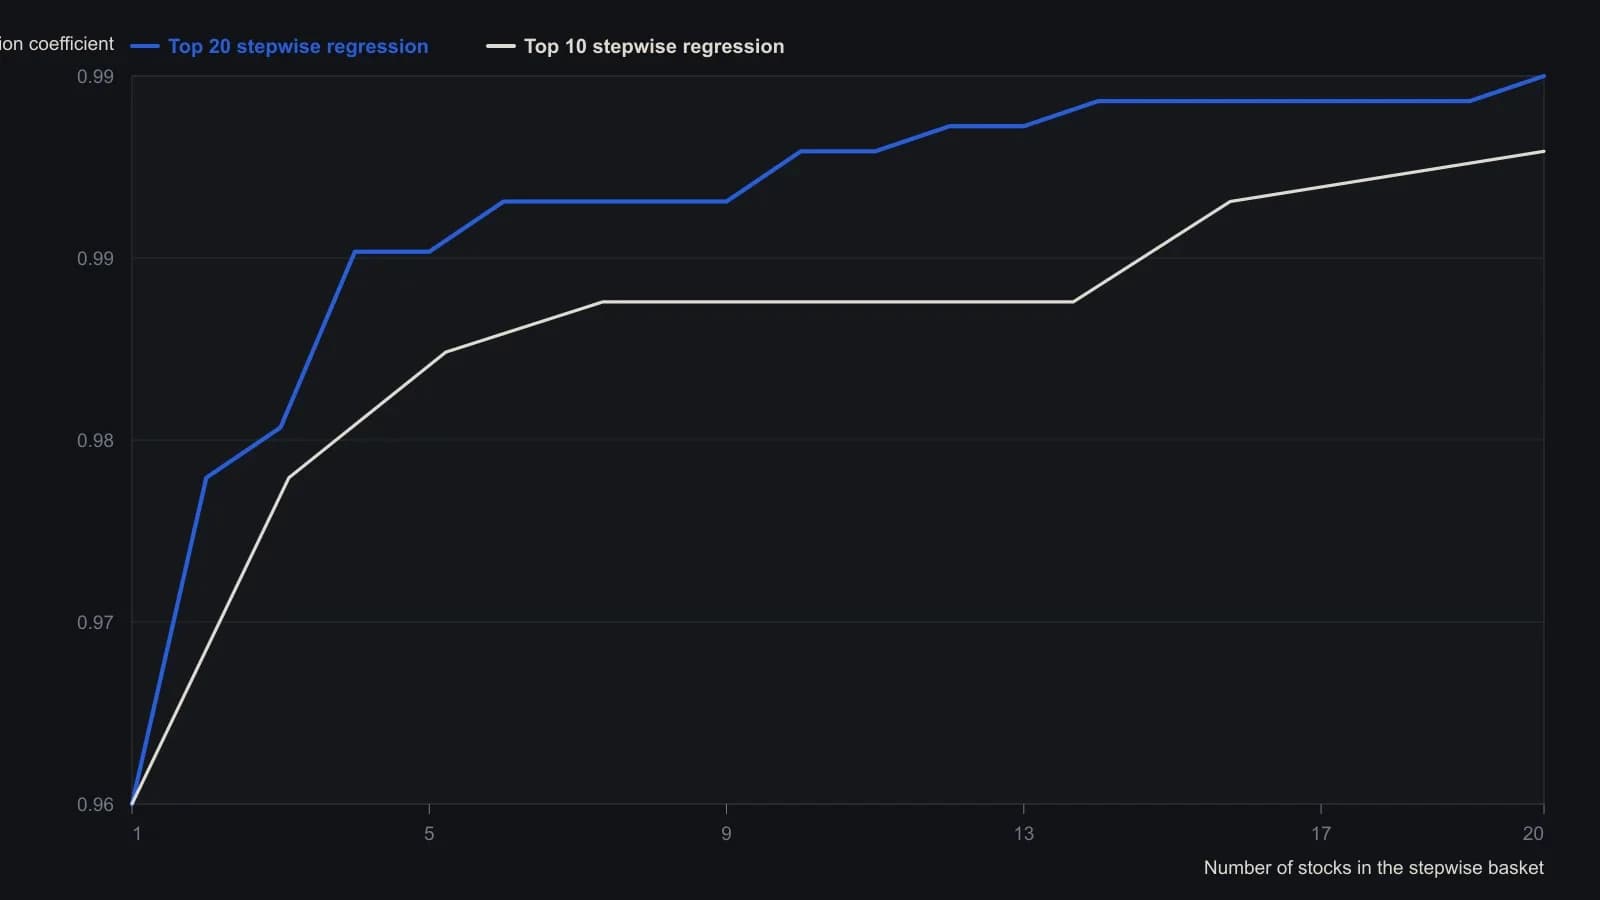
Each value is the cumulative correlation after that stock enters the regression, not that name’s standalone correlation. The 10-stock path adds names in a different order than the 20-stock path.
All readings on this track · 23 readings
- 1982Basis-managed hedges and related market substitutes
- 1990Options as insurance unless the process is complete
- 1996A price-weighted technology index as a hedge and sector proxy
- 2002Single-stock futures as a month, margin, and hedge overlay
- 2004Listed volatility futures as a portfolio volatility hedge
- 2006Customized commodity hedges for bond and equity portfolios
- 2007Use of capital for overnight pairs and hedge layers
- 2007Opening auctions, limit envelopes, and overnight hedges
- 2008A two-gate intermarket test for equity bear hedges
- 2010Gold futures after a large setback: cluster risk and hedge timing
- 2011Partial commodity hedges, seasonal timing, and option income
- 2011Commodity-linked shares are a wrapper, a performance-bond, and a hedge-design problem
- 2012Hedging an open bull vertical
- 2012Construct a two-pair and three-pair hedge rule book
- 2014Equity and SPY stress pairs with a scaled index hedge
- 2015Yearly at-the-money covered calls on a dividend basket
- 2015Pair hedge to hold a valid idea through noise
- 2015Unused peer hedge after an ATR-qualified pair entry
- 2016Continuous index hedges fail the annual cost test
- 2016A VIX overlay as three stacked constraints
- 2018Late-cycle index overlay to keep equity dividends
- 2019Treat a bear-market hedge as a regime switch
- 2019Hedged pairs as game-theory payoffs