1993issue C101-11
Physics analogies for building cycle and money flow indicators
Editorial reading: construction here is a translation of price, volume, and cycle period into a few physics relations, then a check of whether the resulting series turn before the raw chart.
- Restoring-pull uses volume and the measured cycle period as a market analog of spring stiffness, and a changing pull is proposed as a reversal cue.
- On the illustrated June 1993 Deutschemark and S&P 500 charts, a six-bar exponential average of restoring-pull rose before the next price move, eased during that move, then rose again near a reversal.
- A maximum-entropy-spectrum and a cycle-finder overlay both put the dominant-cycle-period near 14 days on the S&P 500 sample, and both fitted worse as the period lengthened.
- If price is treated as a sine wave, true-momentum leads by a quarter cycle, and a six-period money-flow-index preceded every major turn on the illustrated Treasury-bond and S&P 500 charts.
Two series from the same ingredients
The archive builds two related series from volume, price change, and a measured cycle period. Restoring-pull treats volume and that period as a market analog of spring stiffness. The money-flow-index is a smoothed true-momentum series, and true-momentum is volume times the bar-to-bar price change.
The dominant-cycle-period is estimated from ordered prices and then inserted into the indicator instead of a fixed lookback. A maximum-entropy-spectrum is used to track that short-term length bar by bar so the period-dependent series can update.
Restoring-pull from volume and cycle period
A market analog of spring stiffness can be written as volume times the square of two-pi divided by the measured cycle period. That constructed series is the restoring-pull.
The restoring-pull construction is not constant whenever volume or the dominant-cycle-period changes. The changing pull is proposed as a reversal cue.
Smoothed restoring-pull on the illustrated charts
On a June 1993 Deutschemark chart, a six-bar exponential average of restoring-pull rose before prices rose, eased as prices rose, then rose again near a trend reversal.
On a June 1993 S&P 500 chart, the same smoothed restoring-pull series rose before a downtrend, eased as prices fell, then rose again before an upside reversal.
June 1993 Deutschemark with restoring-pull indicator
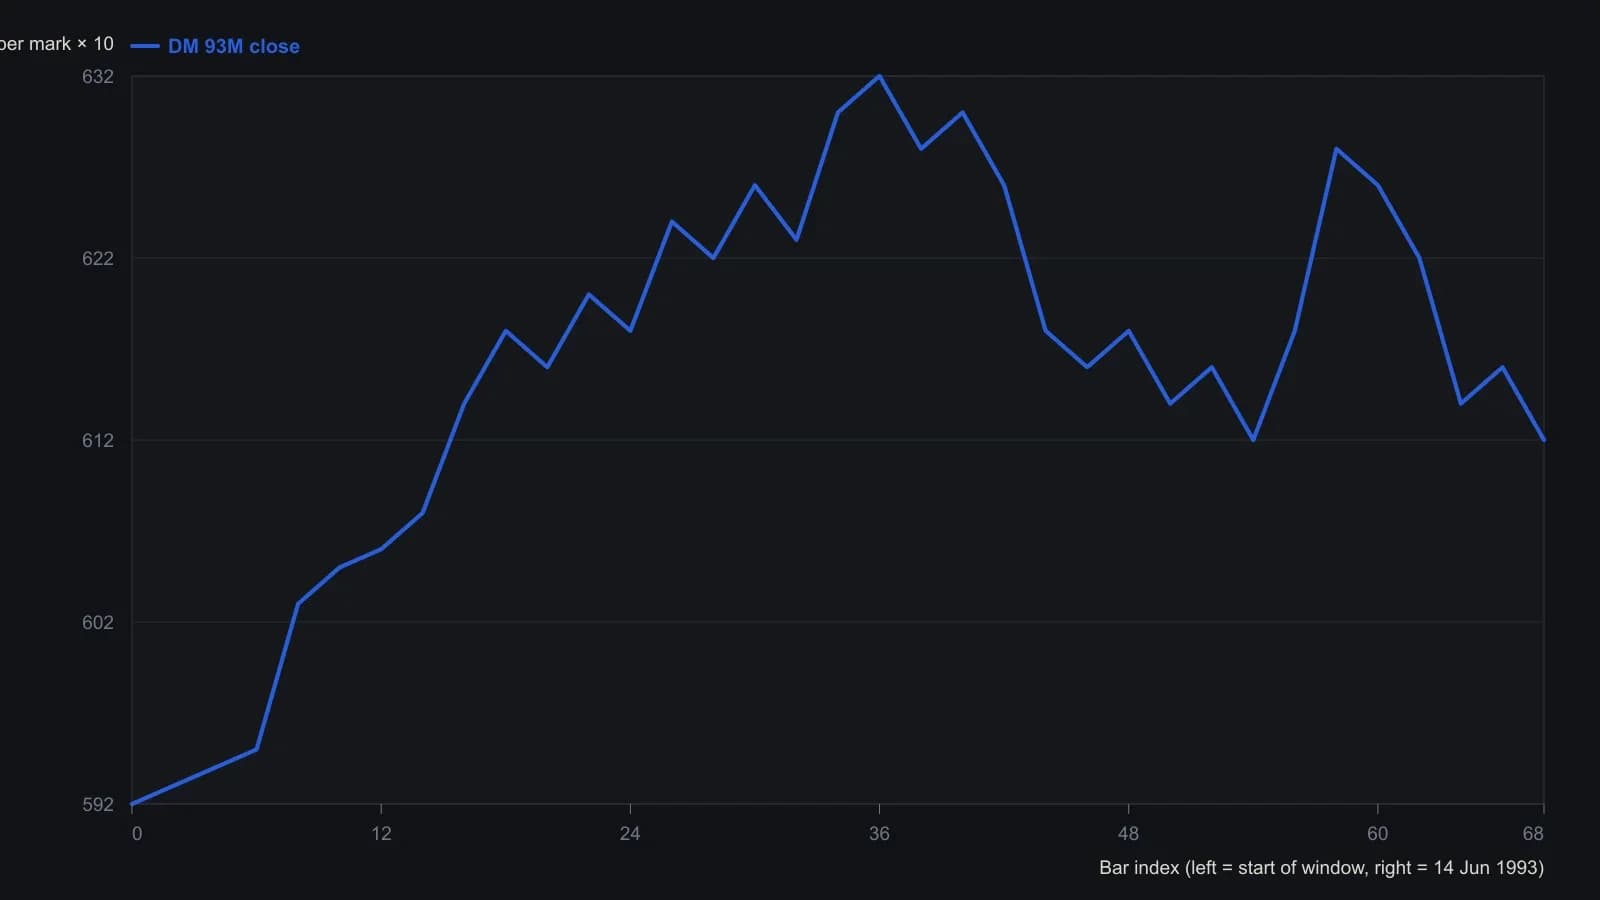
RPI is Volume times (2π/Period) squared, then smoothed with a six-bar EMA. The lower pane has no printed scale, so those points are relative height only and must not be treated as calibrated indicator units. Price quotes on the header are in cents (last bar OP 61.62 HI 61.73 LO 61.54 CL 61.71 on 14 Jun 1993); the left scale is the same series times ten.
Reading the dominant-cycle-period
A maximum-entropy-spectrum of that S&P 500 sample put the dominant cycle near 14 days for most of the window and showed the period lengthening toward the right edge.
Spacing successive lows with a cycle-finder overlay on the same S&P 500 contract also measured about 14 days and likewise fitted worse as the period lengthened.
True-momentum and the money-flow-index
If price is treated as a pure sine wave, volume times price change becomes a cosine series and therefore leads the price wave by a quarter cycle. That product is true-momentum, used as a money-flow signal rather than as a simple price-difference oscillator.
The money-flow-index is the smoothed form of that series. Its turns are compared with later price turns when the market is treated as cyclic.
A six-period exponential average of volume times today’s close minus yesterday’s close preceded every major turn on the illustrated June 1993 Treasury-bond and S&P 500 charts.
All readings on this track · 13 readings
- 1988Constructing tick-weighted money flow and price divergences
- 1989Four-state money-flow-index as permission for a next-bar breakout-system
- 1989Constructing a suggest-then-confirm Money Flow Index
- 1993Five-rung money flow from signed print volume
- 1993Physics analogies for building cycle and money flow indicators
- 1994Keep a wave count as a draft until money flow and a trendline agree
- 1999Take the rectangular-base breakout from money-flow confirmation, not from a late strength average
- 2004Constructing a volume-flow rule from money flow
- 2006Classify the regime before the bar read
- 2015Constructing a bounded money-flow oscillator from range and volume
- 2016Combining RSI, moving averages, and money flow
- 2018Five-rule technical rating as a rotation filter
- 2020Combining money-flow, RSI, and breadth for dynamic pressure zones