1994issue C011-16
Constructing the Chaikin oscillator from close-in-range volume
One close-in-range volume seed is restated as a cumulative accumulation-distribution line, a three-period minus ten-period Chaikin oscillator, and a twenty-one-day money-flow index, so volume demand can be checked apart from price-only momentum.
- Close-in-range volume is a single-session signed weight: how far the close sits from the midpoint of that session's high-low range, then multiplied by session volume.
- A running total of those session weights is the accumulation-distribution line, and the Chaikin oscillator is the three-period simple average of that line minus its ten-period simple average.
- The money-flow index restates the same raw series as a twenty-one-day ratio of summed close-in-range volume to summed volume, scaled as a percentage oscillator rather than another running total.
- Chart construction stacked the cumulative line, a twenty-one-day money-flow oscillator, and a separate internal-strength oscillator so volume demand is not inferred from price-only momentum.
The session seed
Editorial: TradersWeek reads this archive workflow as a reuse chain. One close-in-range volume seed is restated as a cumulative accumulation-distribution line, a short-minus-intermediate oscillator, and a windowed money-flow ratio so demand can be falsified independently of price-only momentum.
Each session's raw money-flow value is the close's signed position inside that session's high-low range, multiplied by that session's volume. That single-session signed weight is close-in-range volume.
The accumulation-distribution line and the Chaikin oscillator
A running total of those daily raw values produces the cumulative money-flow line, also identified as the volume accumulation-distribution line.
The Chaikin oscillator is the three-period simple moving average of that cumulative line minus its ten-period simple moving average.
The oscillator was specified without the opening print after published opens disappeared from newspapers, using only volume and the close versus the day's range.
Earlier short-term work monitored an accumulation-distribution line together with a three-day versus ten-day oscillator of that line to mark daily price-volume divergences.
The money-flow index and persistency
The twenty-one-day money-flow index is the twenty-one-day sum of the same raw daily series divided by the twenty-one-day sum of volume, scaled as a percentage oscillator rather than another running total.
The twenty-one-day money-flow series can be further smoothed with a ninety-day simple moving average.
A persistency score counts the share of days, over a six-month or 120-trading-day window, on which the money-flow reading is simply positive, ignoring magnitude. That share is money-flow persistency.
Gold 21-day money-flow oscillator, 1993
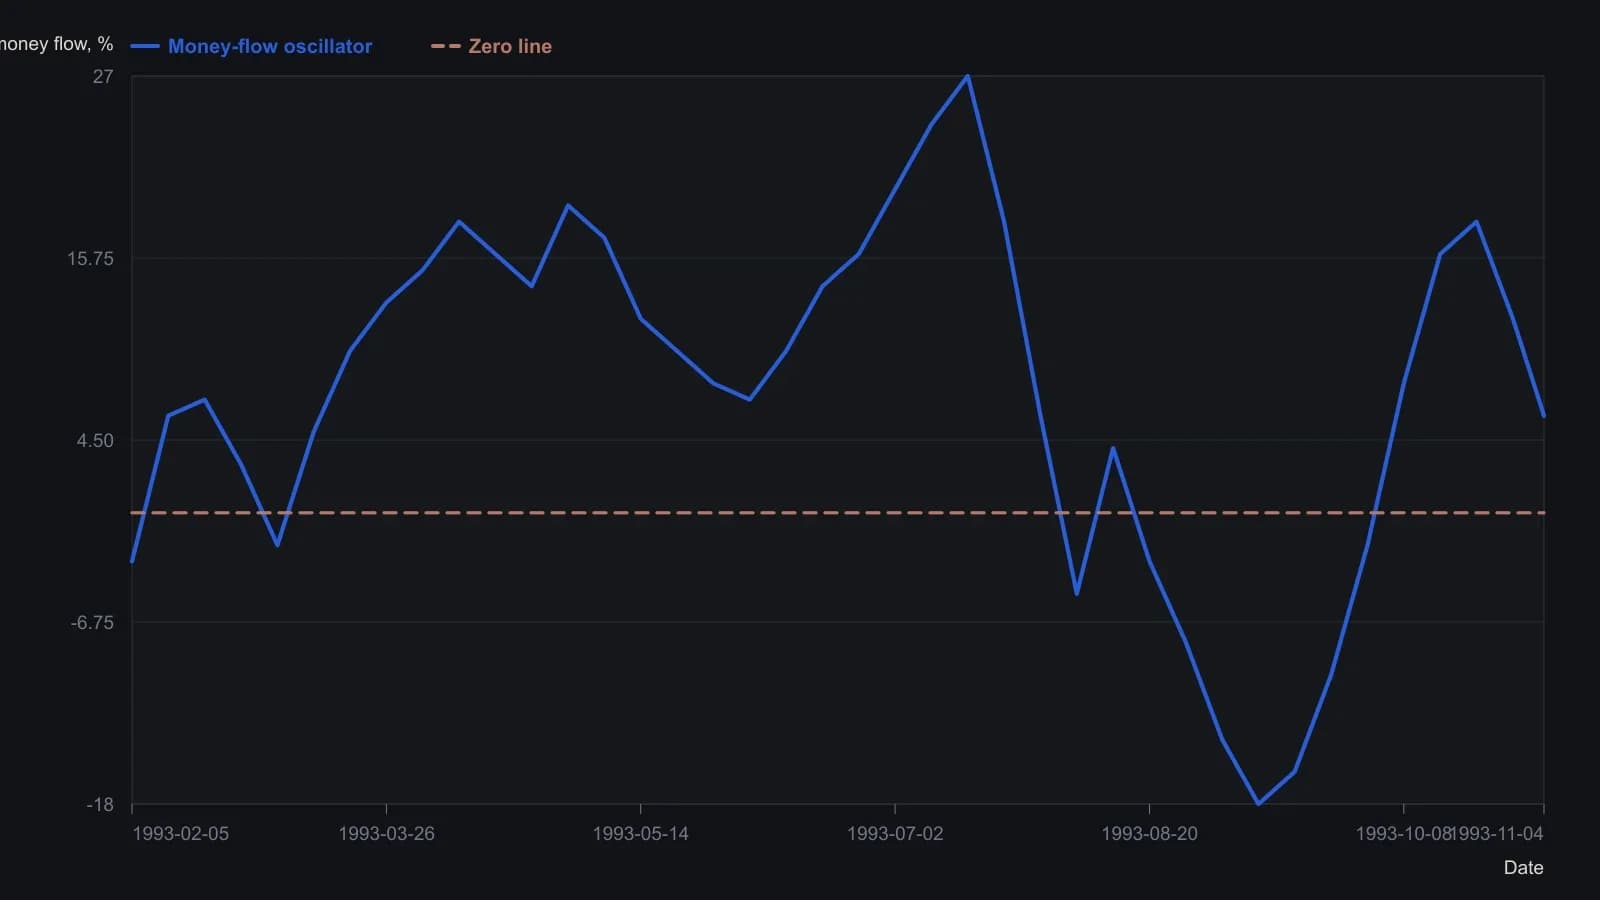
The pane is numbered only at +25 and at zero, so amplitudes are approximate to a few oscillator points. $Flow%21 is the 21-day sum of close-in-range accumulation/distribution divided by 21-day volume.
Volume demand beside a price oscillator
A positive money-flow reading can coexist with a short-term oversold price oscillator when down-day volume is lighter than up-day volume, or when a down close still sits above the day's midpoint.
Chart construction stacked the cumulative money-flow line, a twenty-one-day money-flow oscillator, and a separate internal-strength oscillator so volume demand is not inferred from price-only momentum.
Editorial: that pairing is the demand-supply mix, a construction rule that pairs a volume-based series with a separate momentum series so both are not just restatements of price.
All readings on this track · 9 readings
- 1992Fitting oscillator parameters to stock personality
- 1994Constructing the Chaikin oscillator from close-in-range volume
- 1994Constructing Chaikin money flow and a double-exponential smoother
- 1994A three-lock reversal drill: line, oscillator, and volume
- 2000Constructing a Chaikin oscillator from the accumulation-distribution line
- 2005Volume-spike alerts versus direction from follow-through
- 2014A 2014 research stack as a classroom for volume-flow hypotheses
- 2015Money flow oscillator construction from volume pressure
- 2017Small-cap swing entries that wait for accumulation and Chaikin to clear