1999issue C121-8
Assembling the daily auction from time-price opportunities
Market Profile is built as a rotated distribution of time, price, and volume. The finished map of value and control is used to test a moving-average crossover before that signal is treated as executable.
- Market Profile is a rotated distribution of time, price, and volume, not a conventional buy or sell indicator.
- Each TPO letter records one half-hour at a price, and the value area is the band treated as the day's accepted equilibrium.
- A move away from value on drying volume is constructed as rejection; the same move on rising activity is constructed as a revaluation of value.
- A five- and 10-day moving-average crossover can print before the profile shows control, so the signal remains a hypothesis.
A distribution map, not a signal
Market Profile is constructed as a rotated normal-distribution map of time, price, and volume, not as a conventional buy or sell indicator.
It is a decision-support map of time, price, and volume that organizes the session into a distribution rather than issuing buy or sell recommendations.
How time-price opportunities build the day
Each TPO letter records one half-hour of trading at a price. That letter is the building block of the daily profile.
The letter-to-clock mapping is not consistent across vendors, so the same letter need not mark the same clock interval in every display.
Day type is read from how the TPO distribution forms, including double-distribution structure when two separate value clusters appear.
Value area and the volume overlay
The value area is defined as the band containing about 70 percent of the session's trades and is treated as the day's equilibrium.
Volume profile is the volume overlay that shows whether a move away from value is being accepted or rejected.
A move away from value on drying volume is constructed as rejection. The same move on rising activity is constructed as a revaluation of value.
Initiative, responsive, and bracketing activity
Initiative activity is trade that continues in the direction of the prior session's control rather than fading it. Responsive activity is trade that fades an excursion from value and tries to return price to the accepted area.
The two are classified by whether longer-horizon participants continue or fade the prior day's control.
A bracketing market is identified when both other-timeframe buyers and sellers respond at the edges of a range. It is a range-bound auction in which both longer-horizon buyers and sellers answer at those edges.
Checking a moving-average crossover against control
A five- and 10-day moving-average crossover can print a sell signal before the profile shows sellers in control. The crossover is treated as a hypothesis rather than an executable condition.
A moving-average crossover is a chart signal from shorter and longer averages. It must still be checked against who controls the profile.
September 1999 T-bonds through the late-August breakdown
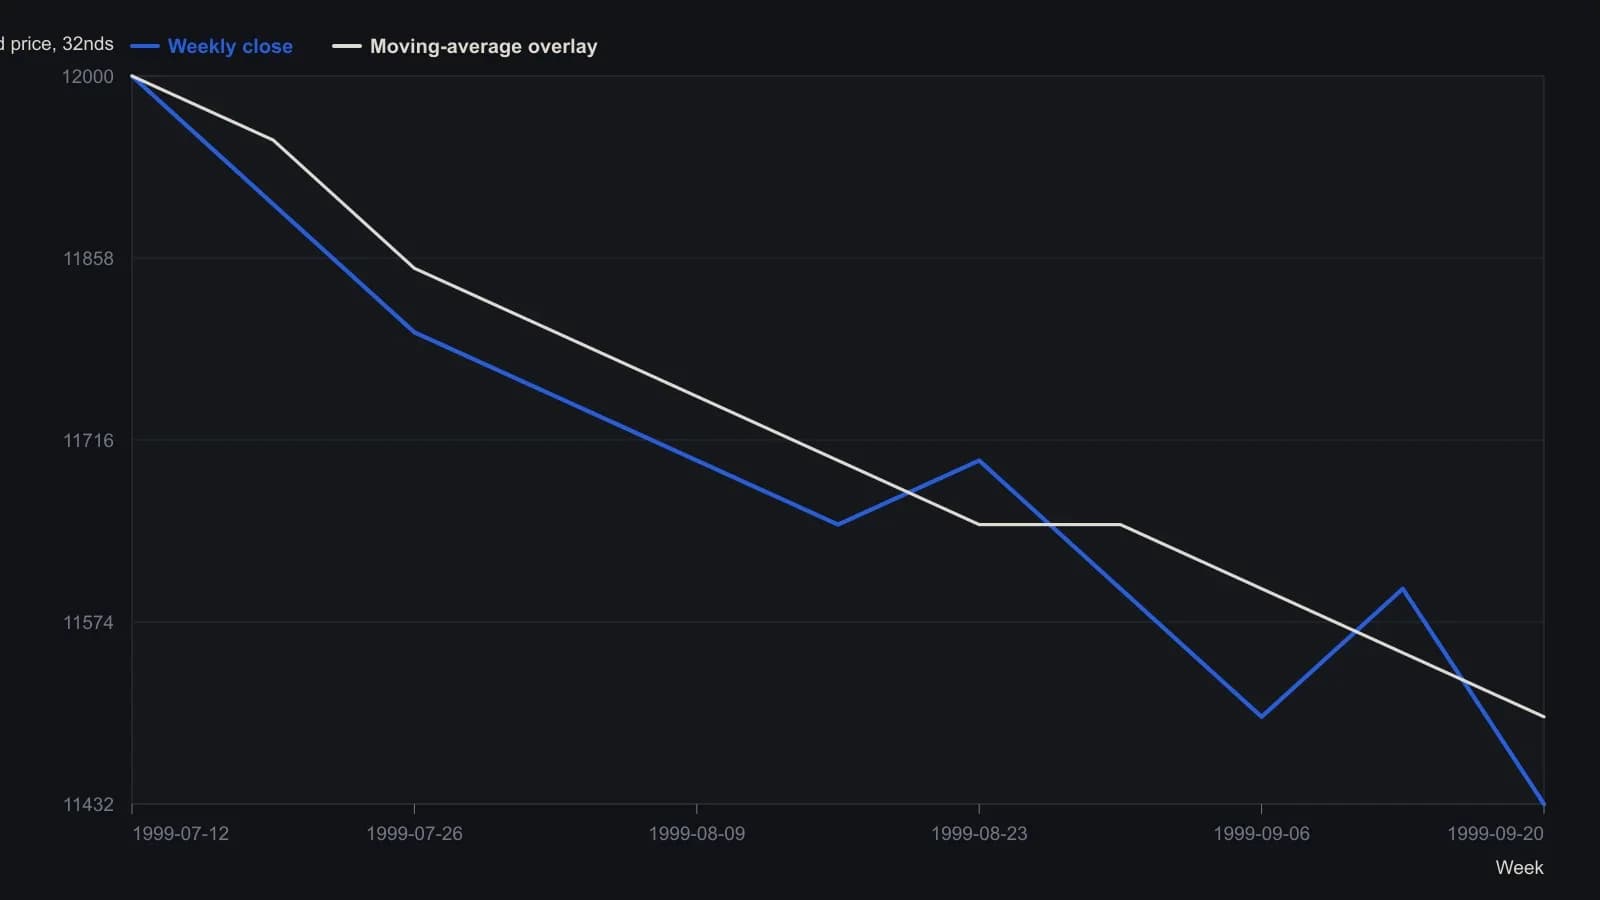
Closes other than the 20 September print of 11432 are digitized from the screenshot and rounded to the nearest 50 in the platform’s 32nds display. The article overlays both a 5-day and a 10-day average; only one smooth overlay is separable on the raster, so that single trace is shown. The left side of the same chart is hidden under the Market Profile callout and was not read.
The same construction beyond futures
The same construction can be applied beyond futures. Equity profile displays are available from software vendors.
All readings on this track · 20 readings
- 1987Intraday Value Area construction from TPO counts
- 1987Constructing session market profiles from half-hour auctions
- 1988Volume value area versus time-print filters
- 1988Auction control from a price, volume, and time ledger
- 1988Constructing intraday trade-facilitation percentile tables
- 1988Constructing session decisions from auction age and volume
- 1989Range extension after the opening auction
- 1989Constructing value maps from auction volume overlays
- 1989The bull hook as a next-session opening-range breakout filter
- 1990Incomplete volume-at-price samples and auction reads
- 1990Constructing overlay profiles to map auction value
- 1990Constructing daily overlay profiles for auction brackets and breaks
- 1990Volume-confirmed facilitation as an execution gate for half-hour breakouts
- 1992Volume-box construction with named spreadsheet macros
- 1993Commercial volume caps outside the value area
- 1993Hourly participant volume as a live filter for day trades
- 1999Assembling the daily auction from time-price opportunities
- 2000Who accepted price first in the auction
- 2002Treat the session as an auction: find value, then judge the breakout
- 2002Auction structure, trader constraints, and the opening range