1989issue C041-6
Range extension after the opening auction
Range extensions were framed as the opening-range breakout many systems already track, then timed and sized on Market Profile session clocks. Across twelve nearby futures, day-time-frame trade was treated as usually building an initial balance in the first two half-hour brackets before a later imbalance could be read as a range extension.
- Range extensions were framed as the same opening-range breakout event many systems already track, then tabulated for day-to-day timing and size on Market Profile session clocks.
- Day-time-frame trade was treated as usually forming an initial balance in the first two half-hour brackets, after which a range extension was attributed to other-time-frame imbalance.
- With CBOT corn initial balance assigned to the D and E periods, the first range extension of the day occurred in the F period in 32 percent of sessions and clustered in the half-hour just after the opening hour.
- A vigorous extension in the next bracket can be read as other-time-frame entry or as unfinished convergence to initial balance, so the length of the opening auction has to be judged market by market.
Opening range on a session clock
Range extensions were framed as the same opening-range breakout event many systems already track. The study tabulated their day-to-day timing and size on Market Profile session clocks. Market Profile is the half-hour lettered auction map used to mark the opening balance range and any later price probe beyond it.
Day-time-frame trade was treated as usually forming an initial balance in the first two half-hour brackets. After that opening range, a range extension was attributed to other-time-frame imbalance, meaning longer-horizon participation that can drive a later imbalance once an initial range has formed. Frequency and magnitude of those extensions were counted for twelve nearby futures markets from 1 February through 29 July 1988.
When the first extension printed
Session analysis counted, period by period, when the first imbalance appeared and how often later brackets kept extending the range. With CBOT corn initial balance assigned to the D and E periods, the first range extension of the day occurred in the F period in 32 percent of sessions and in the G period in 19 percent. Across the sample that first extension clustered in the half-hour just after the opening hour.
When every half-hour that contained a range extension was counted, CBOT corn still extended most often in F, in 32 percent of sessions, and in G, in 29 percent. Those shares do not add to 100 percent because one session can extend in more than one period.
Range-extension frequency by Market Profile half-hour
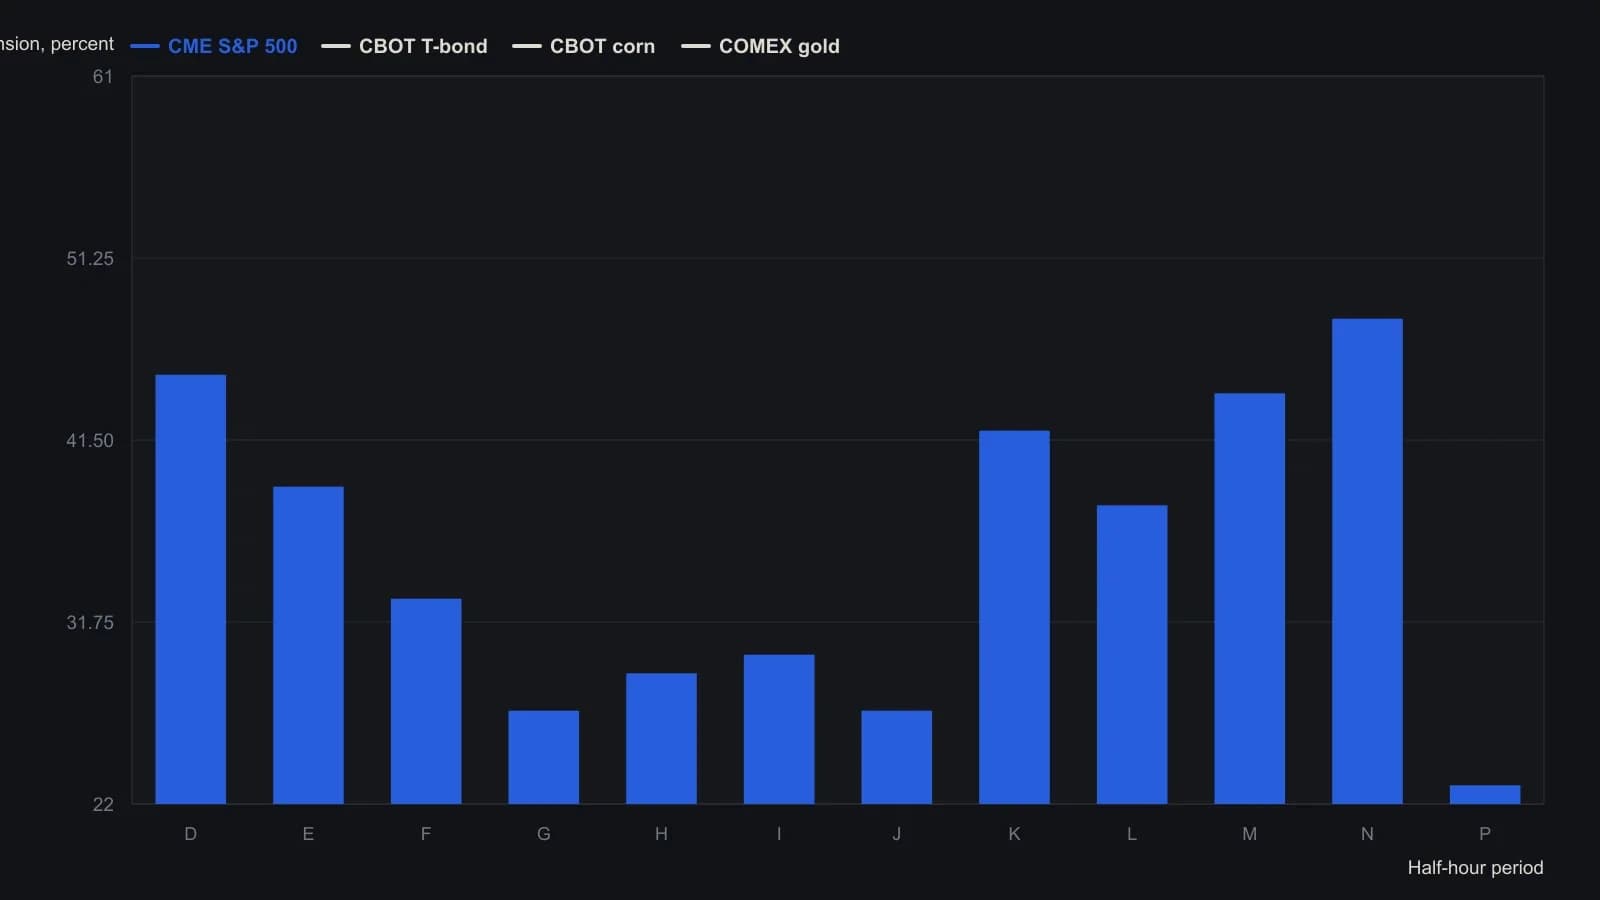
Rows do not sum to 100 percent because the same session can extend in more than one period. S&P 500 period P is 15 minutes; T-bond is the day session only.
Where participation sat
Volume profile located activity inside those extensions by using tick counts to identify which half-hour carried the most participation. Tick volume is a print-count proxy for how vigorously a given half-hour range extension traded. Using that proxy, the single most active CBOT corn range-extension period was F in 18 percent of sessions and G in 16 percent, and that distribution does add to 100 percent.
A 30-minute CME September 1988 S&P 500 sample from 21 July to 3 August 1988 showed relatively high tick volume in the first one or two half-hour periods, then quieter mid-session trade and another late-session burst.
A first hour that may still be open
Both the frequency and the vigor of range extension tended to peak early and late in the session. The same pattern was noted for CME S&P 500 and CBOT T-bond futures from 9 April 1987 through 30 March 1988.
A vigorous extension in the bracket right after the first hour can be read either as other-time-frame entry or as unfinished convergence to initial balance. Whether the opening auction lasts only two half-hour brackets has to be judged market by market.
All readings on this track · 20 readings
- 1987Intraday Value Area construction from TPO counts
- 1987Constructing session market profiles from half-hour auctions
- 1988Volume value area versus time-print filters
- 1988Auction control from a price, volume, and time ledger
- 1988Constructing intraday trade-facilitation percentile tables
- 1988Constructing session decisions from auction age and volume
- 1989Range extension after the opening auction
- 1989Constructing value maps from auction volume overlays
- 1989The bull hook as a next-session opening-range breakout filter
- 1990Incomplete volume-at-price samples and auction reads
- 1990Constructing overlay profiles to map auction value
- 1990Constructing daily overlay profiles for auction brackets and breaks
- 1990Volume-confirmed facilitation as an execution gate for half-hour breakouts
- 1992Volume-box construction with named spreadsheet macros
- 1993Commercial volume caps outside the value area
- 1993Hourly participant volume as a live filter for day trades
- 1999Assembling the daily auction from time-price opportunities
- 2000Who accepted price first in the auction
- 2002Treat the session as an auction: find value, then judge the breakout
- 2002Auction structure, trader constraints, and the opening range