1988issue C011-6
Constructing a value area from TPO, volume, and order flow
A session is assembled from time, price, and volume into a high-low range and a value area that holds about 70% of the day's trades. Time-price opportunities, adjacent volume, TPO count, and residual customer flow are used to grow that band and to read whether a probe is accepted or left behind.
- A session is assembled from time, price, and volume: the day forms a high-low range plus a value area where prices cluster, and volume is produced by how long price spends at each level.
- A brief time-price relationship is treated as unaccepted and the auction leaves that area; an extended time-price relationship is treated as accepted value.
- The value area is the band containing about 70% of the session's trades, built by starting at the highest-volume price and repeatedly adding the larger adjacent volume until that threshold is reached.
- On consolidating, normal-profile days, TPO count reads willingness to accept a print away from the highest-volume price, while residual volume of about 25% to 35% was described as more able to affect direction when it is large.
A session assembled from time, price, and volume
A session can be assembled from time, price, and volume. The day forms a high-low range plus a value area where prices cluster, and volume is produced by how long price spends at each level.
When price spends little time in a range, that area is treated as unaccepted and the auction leaves it. That brief time-price relationship is read as rejection. When price remains there for an extended period, that area is treated as accepted value. That extended time-price relationship is the establishment of value.
Constructing the value area
The value area is built as alternating high and low probes create time-price opportunities. A time-price opportunity is a half-hour occupancy of a single price, the letter-box used to build a market-profile distribution. Rising prices tend to increase supply and reduce demand, while falling prices do the reverse, encouraging consolidation where most trades occur.
The value area is defined as the band containing about 70% of the session's trades. Construction starts at the highest-volume price, then repeatedly adds the larger adjacent volume above or below until that 70% threshold is reached.
The highest-volume price is the value-area price that appears in the most half-hour periods. If two prices tie, the one closer to the middle of the day's range is selected.
Pioneer range
The pioneer range is the price span of the first two half-hour brackets. In longer stock-index sessions the first five or six consecutive brackets may be used instead.
Liquidity providers and residual volume
Day-time-frame locals typically buy strength and sell weakness while aiming to trade the bid or offer and supply liquidity. Other-time-frame commercials more often seek the low end of the range to buy and the high end to sell, so their responses to probes can support lows and resist highs.
The customer-trade indicator splits participants four ways into locals, commercials, member-order fillers, and public-order fillers, so that liquidity-providing flow can be separated from residual customer flow. Combined local and commercial activity was described as typically 65% to 75% of daily volume with only slight effect on price direction. Residual volume, the combined volume of the two non-local, non-commercial customer groups, was described as about 25% to 35% of daily trade and more able to affect direction when large. Trend potential was associated with residual volume at the high end of that band.
TPO count on a consolidating day
TPO count measures how prints split above versus below the highest-volume price. A balanced split is read as no willingness to accept a divergent price. A heavier count on one side is read as greater willingness to trade in that direction if price probes there. The reading applies only on consolidating, normal-profile days and is difficult when the highest-volume price sits at a value-area extreme.
Editorial: TradersWeek uses that TPO tilt together with residual customer share to decide whether the next probe is rejected liquidity or newly accepted trade.
An illustrated session
In the illustrated session the busiest price was 1926, printing in five half-hour brackets, with 25 TPOs above it and 17 below. The constructed value area ran from 1920 to 1950, versus 1920 to 1932 on the prior day.
TPO count around the 1926 highest-volume price
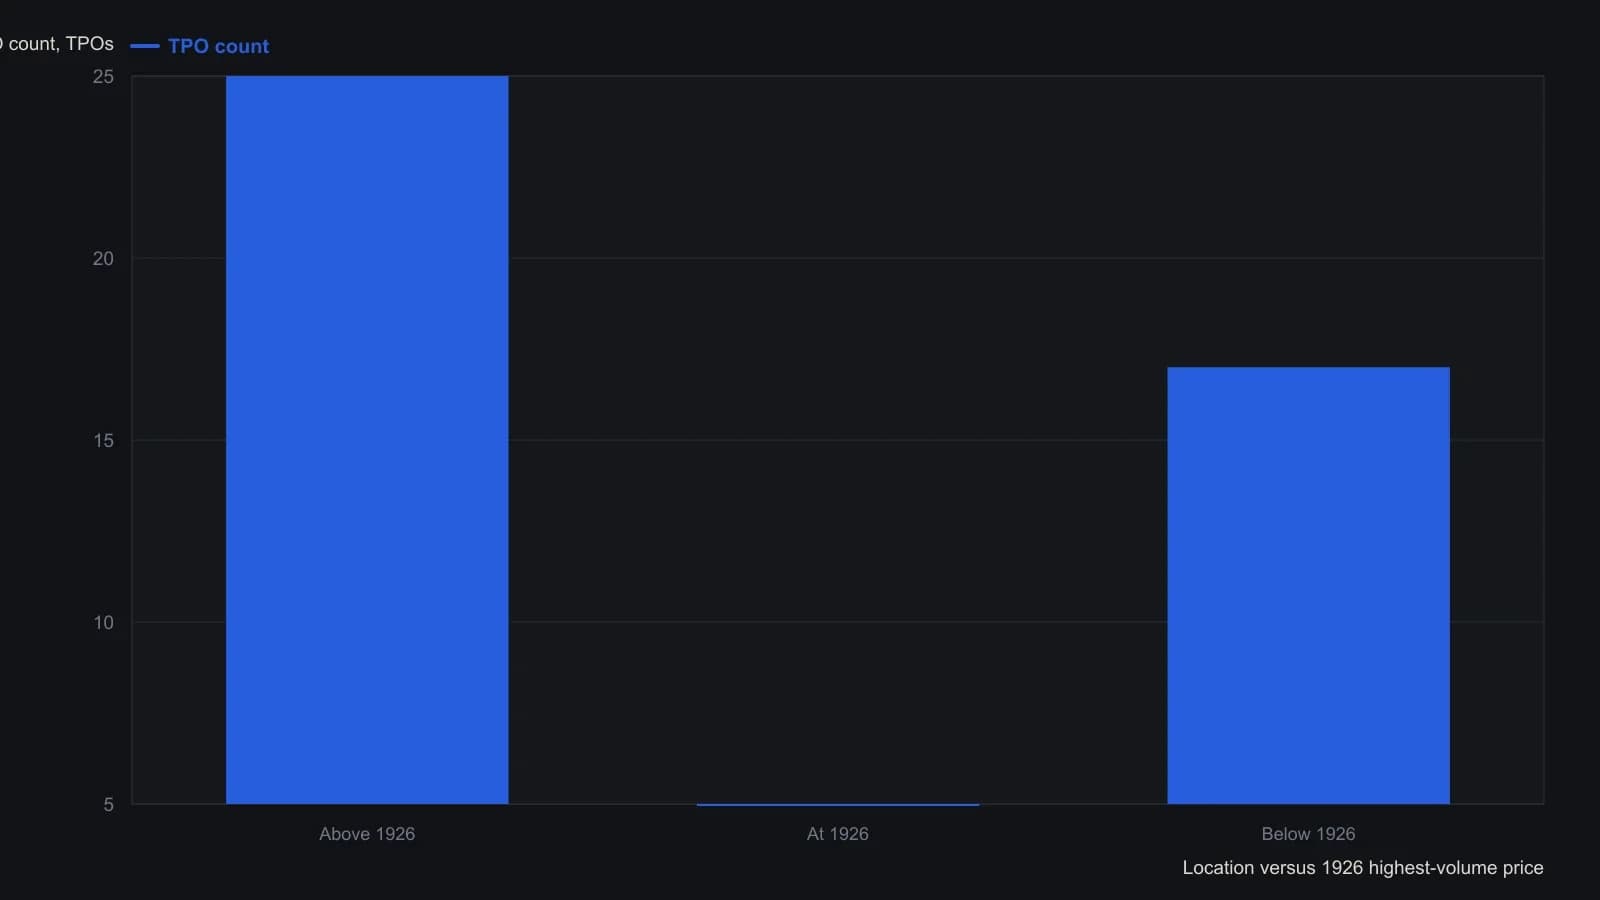
The authors apply this TPO-dispersion read only to consolidating, normal-profile days and say it is hard to use when the highest-volume price sits on a value-area extreme.
All readings on this track · 12 readings
- 1988Constructing a value area from TPO, volume, and order flow
- 1988Constructing Value Area trends from half-hour auction profiles
- 1988Constructing auction structure with volume as a clock
- 1999Direct access routing and the visible book
- 1999A floor-to-screen case for the trading decision
- 2001Round-number clusters behind support and pattern signals
- 2001Displayed-size filters in multi-venue index-share execution
- 2006A high-volume wide bar as an auction-intent check
- 2007Market Profile as auction context for inventory imbalance
- 2008Decimalization, liquidity, and why price-only charts miss the tape
- 2013Liquidity pockets and order routing after the speed race
- 2015Bid-ask queues and the instant-adjustment critique