1989issue C071-9
Constructing value maps from auction volume overlays
Auction-market construction locates accepted value at prices that attract concentrated volume rather than from open-high-low-close summaries alone. A volume-overlay either collapses toward one roughly bell-shaped distribution around a central node or shows discrete value-peaks as the auction relocates.
- Auction-market construction locates accepted value at prices that attract concentrated volume, reading those high-volume regions as a daily consensus rather than inferring value from open-high-low-close summaries alone.
- A volume-overlay that forms one roughly bell-shaped distribution, with a 68 percent band holding about two-thirds of day-counts and a 95 percent band as the outer limit, constructs a bracketing-market still in price-rotation around one node.
- A value-peak qualifies as a node only if activity at that price increases rather than fades. A possible second center whose day-counts decline is not accepted.
- Five separate peaks with successive delays of 3, 6, 15, and 20 days construct a stepping-trend that opened quickly and then slowed. A later rewrite of the latest node, a move back through that peak, and a broader last value area mark the shift into a new bracket.
Accepted value is concentrated volume
Auction-market construction locates accepted value at prices that attract concentrated volume, reading those high-volume regions as a daily consensus rather than inferring value from open-high-low-close summaries alone.
Auction-value is the price the market has accepted, constructed as concentrated volume, equivalently price multiplied by time spent, rather than as an analyst's long-horizon appraisal. The same volume-identified-by-price construction is treated as usable in stocks, bonds, and other auctioned markets whenever trade volume can be attached to each traded price.
Maps that locate the current auction
A market-profile is a daily-to-multi-session map of accepted prices built from time-at-price or equivalent volume, used to locate the current auction rather than to forecast a distant intrinsic value. A volume-profile is a price-stacked histogram of traded volume whose peak marks the consensus node and whose shoulders mark how far the auction still rotates around that node.
A volume-overlay is a composite of several sessions' volume-at-price rows, including a day-count of how many sessions printed each price, used to reveal one bell or several successive bells. Volume-price-analysis reads the shape of volume against price, a single bell, overlapping bells, or a sequence of discrete peaks, as a falsifiable statement about whether value is static or being rewritten.
One bell and its percent-bands
A 10-session Treasury-bond overlay covering 12 to 25 July 1988 produced a single roughly bell-shaped volume distribution that peaked near the center at 86:00. That overlay comprised 55 day-count events. Taking 18 counts on each side of 86:00 placed the 68 percent band between 86:12 and 85:24, the interval where a still-bracketing auction was constructed to spend about two-thirds of its time.
The 95 percent construction on the same 55 events used 52 day-counts and bounded activity between 86:20 and 85:12. Prints outside that interval were read as evidence that 86:00 had ceased to be the consensus node.
A percent-band is a construction rule that treats about two-thirds of overlay day-counts as the one-standard-deviation rotation zone and about 95 percent as the outer limit beyond which the current node is no longer accepted. A bracketing-market is a balanced auction whose overlay collapses toward a single roughly bell-shaped distribution and whose prices rotate back through the central node. Price-rotation is the up-and-down sweep of prints around a still-accepted node while the overlay remains one bell.
A longer overlay that stays one bell
Across the 40 sessions from 1 June through 27 July the 89:24 to 85:12 range still formed essentially one quasi-bell. About one-third of the days traded near the center, and the whole excursion was 4 points against average daily ranges near 1 point.
A possible second center at 88:04 was not accepted as a valid peak because day-counts declined from 7 to 6 instead of rising. A value-peak is a local volume or day-count maximum that qualifies as a node only if activity at that price increases rather than fades.
Five peaks instead of one bell
The prior 40 sessions from 5 April through 31 May spanned 91:04 to 85:04, only 50 percent wider than the later bracket, yet the overlay showed five separate value peaks rather than a single or dual-overlapping bell.
Those five peaks were placed near 90:14 on 12 April, 89:16 on 15 April, 88:20 on 21 April, 87:20 on 6 May, and 85:22 on 26 May, with successive delays of 3, 6, 15, and 20 days, so the trend opened quickly and then slowed.
A stepping-trend is a directional auction that does not print a smooth path but relocates by forming a short-lived bell, then abandoning it for the next one.
When the latest node is rewritten
End-of-trend construction treated a rewrite of the latest node as the diagnostic. After a 31 May peak at 85:20, a subsequent move back up through that peak, together with broadening of the last value area, marked the shift from a stepping trend into a new bracket.
Five volume nodes on the April–May 1988 T-bond overlay
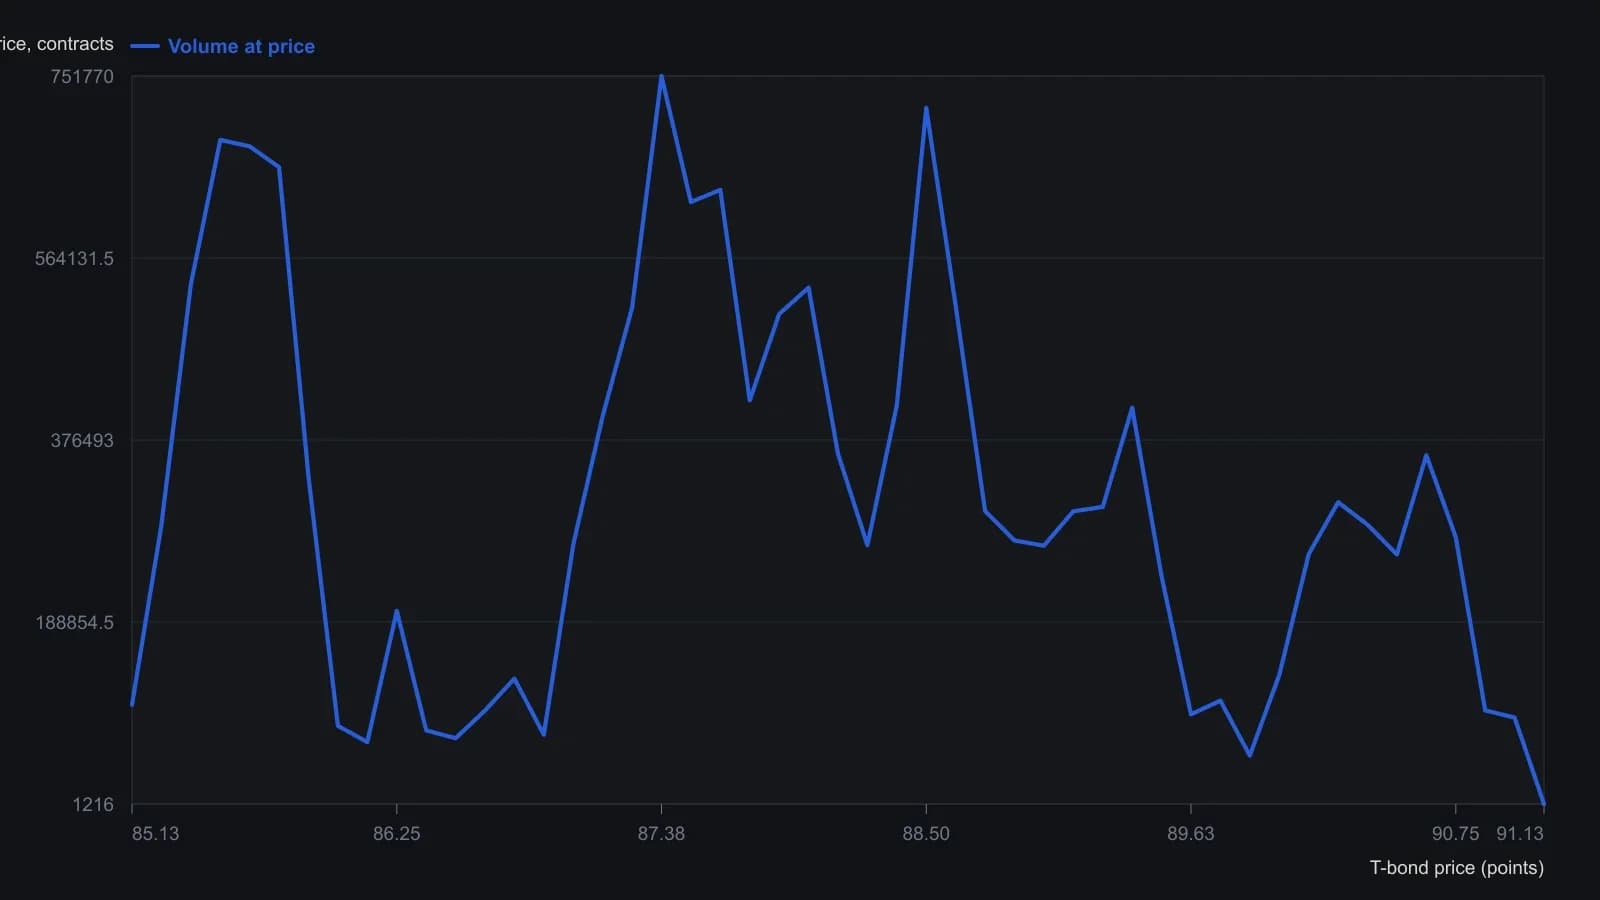
Table prices are CBOT 32nds written as 8504 for 85-04; they are converted to decimal points so the price axis rises in even 4/32 ticks. The printed Peak=50 X-marks are only a histogram scale and are not plotted.
All readings on this track · 20 readings
- 1987Intraday Value Area construction from TPO counts
- 1987Constructing session market profiles from half-hour auctions
- 1988Volume value area versus time-print filters
- 1988Auction control from a price, volume, and time ledger
- 1988Constructing intraday trade-facilitation percentile tables
- 1988Constructing session decisions from auction age and volume
- 1989Range extension after the opening auction
- 1989Constructing value maps from auction volume overlays
- 1989The bull hook as a next-session opening-range breakout filter
- 1990Incomplete volume-at-price samples and auction reads
- 1990Constructing overlay profiles to map auction value
- 1990Constructing daily overlay profiles for auction brackets and breaks
- 1990Volume-confirmed facilitation as an execution gate for half-hour breakouts
- 1992Volume-box construction with named spreadsheet macros
- 1993Commercial volume caps outside the value area
- 1993Hourly participant volume as a live filter for day trades
- 1999Assembling the daily auction from time-price opportunities
- 2000Who accepted price first in the auction
- 2002Treat the session as an auction: find value, then judge the breakout
- 2002Auction structure, trader constraints, and the opening range