2002issue C061-6
Treat the session as an auction: find value, then judge the breakout
A market profile converts the trading unit from a price print to a band of accepted value. Session analysis then asks whether today is still inside yesterday's value or already leaving it, so a breakout is read as a change in accepted value rather than as a chart pattern on its own.
- Price records activity, while value is inferred from where volume and time concentrate, so the working unit is a band of accepted prices.
- Session analysis compares yesterday's value area with today's developing value to judge whether the day is still balanced or already leaving that balance.
- A breakout from balance is an alert that a trend may be starting. It can stall as a failed breakout or continue into a directional run.
- Early session prints can reflect overnight order backlog rather than settled value, and knowledge of value is not a forecast of how far a trend will run.
Price records activity, value is inferred
In this framework, price records activity while value is inferred from where volume and time concentrate. Analysis therefore converts the trading unit from price to a band of accepted prices.
A single-session market profile is a price-versus-volume graph. It typically forms a quasi bell-shaped curve, with heavy trade near the center and little support at the session high and low.
The value area is a group of prices
The value area is defined as the middle 70 percent of the session distribution. It is treated as a group of prices rather than a single fair price.
That band is the map of prices the session currently accepts as fair. Extremes of the same session, where trade is thin, are not treated as that accepted band.
Session volume by price, December 2001 Swiss franc
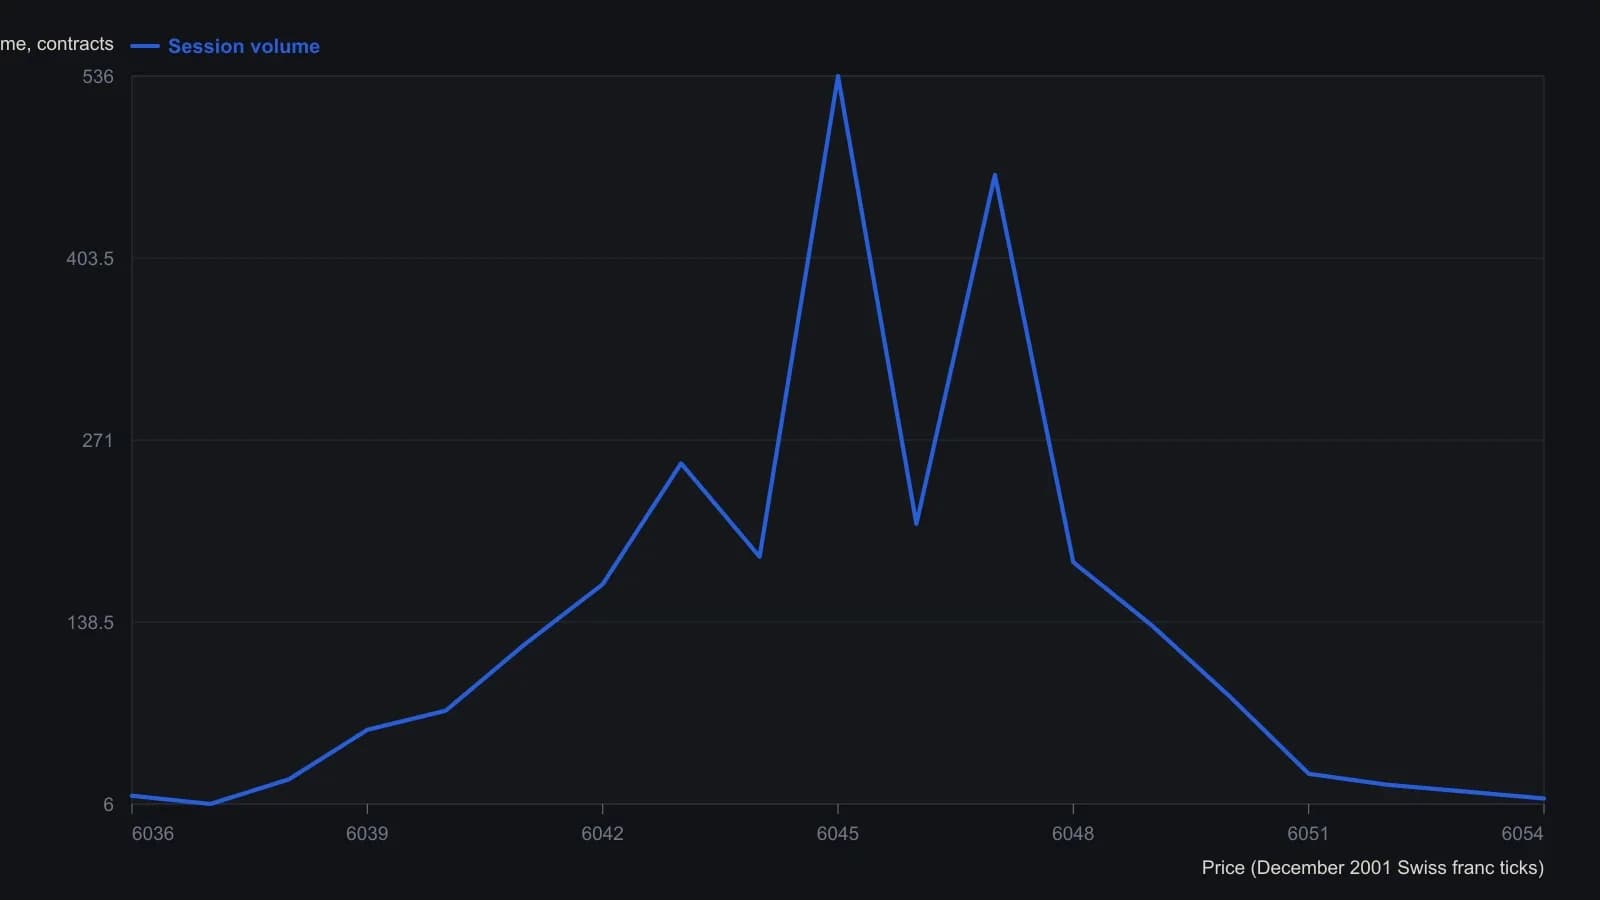
The source omits a 6053 print. It places the 70 percent value area at 6049–6040 from TPO counts, with the point of control at 6047; raw volume instead peaks at 6045. Each mark on its volume plot stood for 10 contracts.
Session analysis watches where today's value sits
Session analysis compares yesterday's value area, today's value so far, and where today's value sits relative to yesterday as the day builds.
The working question is whether today's accepted prices are still rotating inside the prior value area or whether the session is already building value away from it.
A multi-day overlay names the condition
A multi-day overlay demand curve is formed by combining successive session profiles. It is used to classify condition as balance, breakout from balance, trend, or congestion back into balance.
When the market is in balance, the edges of that balance are the reference for upside and downside breakouts. The width of the balance plus the shape of the distribution is used to estimate trading risk.
A breakout from balance is only an alert
A breakout from balance is treated as an alert that a trend may be starting. It often appears on a session profile as a series of single prints. The move can stall as a failed breakout or continue into a directional run.
The end of a directional run is more often marked by congestion than by a clean reversal. Continued congestion is described as the path back into a new balance.
The open can be a backlog, not settled value
Overnight order accumulation can distort prices at the open, so early session prints are treated as a backlog effect rather than as settled value.
Those early prints belong to the opening range, the interval that can still reflect that backlog before the day's value becomes clearer.
Value knowledge does not forecast the path
Market knowledge of value and session phase is not presented as a forecast of how long or how far a trend will run. The expected tell is a later reversal or congestion as the auction returns toward balance.
Editorial: the useful question is not how far the run will go. It is whether accepted value is still the same band, or whether the auction has already left it.
All readings on this track · 20 readings
- 1987Intraday Value Area construction from TPO counts
- 1987Constructing session market profiles from half-hour auctions
- 1988Volume value area versus time-print filters
- 1988Auction control from a price, volume, and time ledger
- 1988Constructing intraday trade-facilitation percentile tables
- 1988Constructing session decisions from auction age and volume
- 1989Range extension after the opening auction
- 1989Constructing value maps from auction volume overlays
- 1989The bull hook as a next-session opening-range breakout filter
- 1990Incomplete volume-at-price samples and auction reads
- 1990Constructing overlay profiles to map auction value
- 1990Constructing daily overlay profiles for auction brackets and breaks
- 1990Volume-confirmed facilitation as an execution gate for half-hour breakouts
- 1992Volume-box construction with named spreadsheet macros
- 1993Commercial volume caps outside the value area
- 1993Hourly participant volume as a live filter for day trades
- 1999Assembling the daily auction from time-price opportunities
- 2000Who accepted price first in the auction
- 2002Treat the session as an auction: find value, then judge the breakout
- 2002Auction structure, trader constraints, and the opening range