1993issue C011-11
Commercial volume caps outside the value area
Commercial member volume usually sits inside the session value area. When that flow prints heavily outside value, the archive treated the extreme as the auction's own support or resistance rather than a line drawn after the fact.
- In a bracketing market the value area is the exchange band that holds 70 percent of session volume, and commercials are described as aiming to transact inside it.
- Quiet commercial inventory stays inside that band. Commercial capping is unusually heavy commercial member volume at an extreme that interrupts a probe and sends price back toward accepted value.
- A July soybean pair of sessions and a December T-bond session used the same volume-profile split to mark upside and downside caps, even though commercials were about 4 percent of soybean volume and about 16 percent of T-bond volume.
- Those outside-value concentrations were later treated as support and resistance, and by implication as clues to multiday value.
Value in a bracketing market
In a bracketing market the auction is two-sided and range-bound. Short-term value is the price region that attracts the most trade over the enclosed period, not a one-way migration of value. The exchange marks a session value area as the band containing 70 percent of that day's volume and treats that band as the day's accepted value.
A market-profile map of price, time brackets, and accepted-value structure is used to see where trade was built and where it was rejected. A volume-profile record is the price-by-price count of transacted volume, including participant-class shares, and is used to locate concentration inside and outside the session value area. A time bracket is a half-hour auction period label used to reconstruct when volume printed at a given price.
Commercials as a locator of accepted value
Commercial participants are described as using futures mainly for business inventory rather than outright speculation, and as aiming to transact inside the day's value area. Commercial member volume is the share attributed to that group. Read on a volume-profile, that share is treated as a running locator of accepted value.
A quiet soybean session and a capping session
On one quiet soybean session, commercial volume was 3 percent of the day, with 2.5 percentage points inside the value area and only 0.2 above and 0.3 below. Almost all of that day's commercial member volume sat inside accepted value.
On the next soybean session, commercial volume concentrated at 5900, 5896, and 5890, all above the value area. Tick volume from 12:30 to 1:00 p.m. clustered around those highs. The close then returned into the session value area at 5874.
That second session is commercial capping: unusually heavy commercial volume at a session extreme that interrupts a probe and sends price back toward accepted value. A later daily summary treated the 5900 soybean print as a lasting upside cap and as the last resistance identified before the market turned lower.
In one July soybean sample, 15 of 21 sessions showed unusually high commercial activity outside the value area, so intervention at extremes was more common than quiet nonintervention that month.
Low-side caps in T-bonds
In a December T-bond session, commercials accounted for 15.6 percent of volume, of which 3.4 percentage points printed below the value area versus 12.0 inside and 0.2 above. That below-value share was described as 70 percent higher than a 2.0 average for volume below value.
Heavy commercial prints ran from 9826 up toward 9905 into the T-bond value area. Similar low-side capping was identified on June 5, 9, and 12, including an immediate commercial response after an early probe to 9825.
Commercial share of March 1993 T-bond volume by price
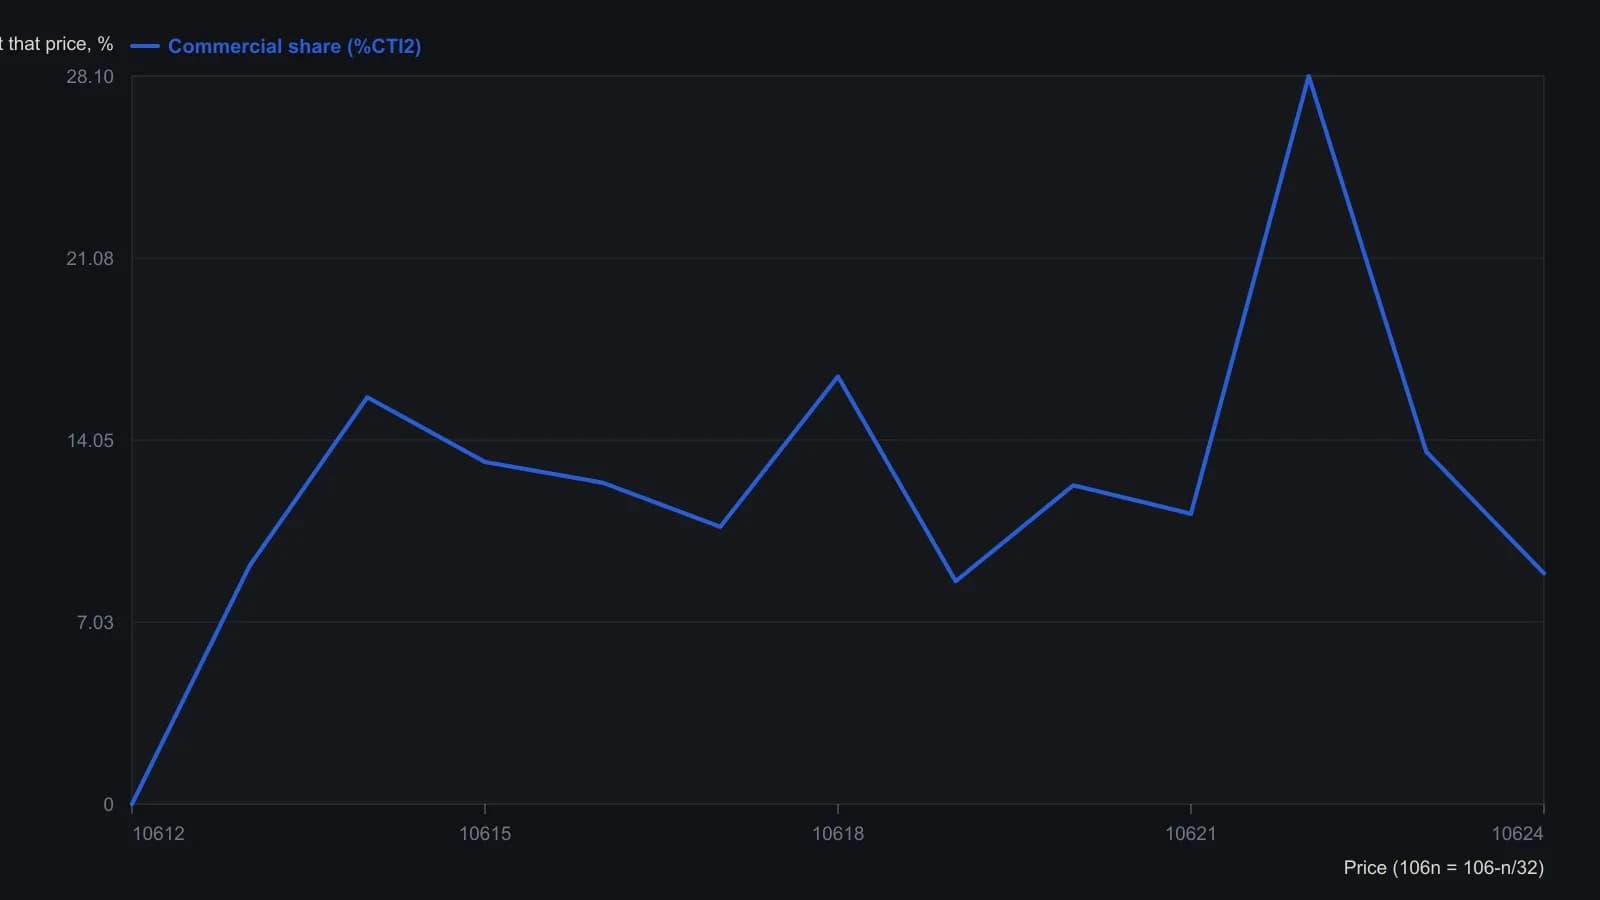
Mid-session Liquidity Data Bank download at 10:06, not official full-day volume. Price 10622 means 106-22/32.
Same reading at two different commercial shares
Commercials were about 4 percent of soybean volume and about 16 percent of T-bond volume, yet both cases were used the same way: to locate support and resistance and, by implication, longer-term value.
In this workflow, support and resistance are auction extremes where commercial inventory repeatedly absorbs a probe, leaving a floor or ceiling until conditions change. The session value area remains one day's accepted value. Multiday value is the longer-horizon fair-price region built from stacked daily auctions, distinct from a single session's value area.
Read the cap before drawing the line
Editorial interpretation: first separate commercial member volume into quiet inventory inside the value area and commercial capping outside it. Then treat those caps as the auction's own support and resistance. The archive already located the 5900 soybean print and the repeated T-bond lows in the volume-profile. Drawing the same lines later does not add a new level.
All readings on this track · 20 readings
- 1987Intraday Value Area construction from TPO counts
- 1987Constructing session market profiles from half-hour auctions
- 1988Volume value area versus time-print filters
- 1988Auction control from a price, volume, and time ledger
- 1988Constructing intraday trade-facilitation percentile tables
- 1988Constructing session decisions from auction age and volume
- 1989Range extension after the opening auction
- 1989Constructing value maps from auction volume overlays
- 1989The bull hook as a next-session opening-range breakout filter
- 1990Incomplete volume-at-price samples and auction reads
- 1990Constructing overlay profiles to map auction value
- 1990Constructing daily overlay profiles for auction brackets and breaks
- 1990Volume-confirmed facilitation as an execution gate for half-hour breakouts
- 1992Volume-box construction with named spreadsheet macros
- 1993Commercial volume caps outside the value area
- 1993Hourly participant volume as a live filter for day trades
- 1999Assembling the daily auction from time-price opportunities
- 2000Who accepted price first in the auction
- 2002Treat the session as an auction: find value, then judge the breakout
- 2002Auction structure, trader constraints, and the opening range