1990issue C071-12
Constructing daily overlay profiles for auction brackets and breaks
A daily overlay is built from four layers: stacked session volume, a rotation map, a rotation score, and the close location. Together they show when the present auction is still one bracketing value area and when a second distribution has already started.
- Four daily-updated pieces construct the overlay: overlay shape, a rotation map, a rotation score, and the close quadrant.
- A bell-shaped overlay with well-scattered rotation marks bracketing, so prices between the overlay limits are treated as one value area until a limit is broken.
- A second distribution plus a rotation index below 0.6 is used to treat a break of a bracket limit as the start of a directional phase, confirmed no later than the second session close.
- End-of-day overlays are presented as sufficient because they reduce intraday noise, and the read is specific to the present auction rather than a fitted model.
A four-layer daily construction
The overlay is built as four layers that update each day. Session volume is stacked into one overlay profile. A rotation profile maps how price printed across days. A rotation index scores whether that rotation is still active. The quadrant of close locates the finish inside the recent range.
Those four pieces describe current auction condition. They show when an auction is still building a single value area and when a second distribution has already started. End-of-day overlays are presented as sufficient because they reduce intraday noise.
Overlay shape and stacked value
A market profile is a stacked, session-by-session auction map. It locates value, bracket limits, and new distributions from how price and volume organize over several days. A volume profile is the cross-session time-and-volume construction that shows whether activity remains concentrated in one value area or is forming a second distribution at a new price.
The overlay profile is the composite shape formed by adding successive sessions. A single bell often marks one bracketing value area. A new lobe marks a second distribution.
A bell-shaped overlay plus a well-scattered rotation map identifies a bracketing auction. In that state the full bracket span is treated as value because those prices have similar occurrence likelihood.
Rotation map and rotation index
The rotation profile is a day-symbol map of where each session printed. Even scatter through the range supports bracketing. Bunching or one-way prints support a directional phase.
The rotation index is a short-window and longer-window score of how much price is rotating. Eight-day and four-day rotation scores generally above 0.6 were used as evidence of good rotation. Scores below 0.6 were treated as low-rotation, trend-type readings.
Close quadrant and session analysis
The quadrant of close is a four-bin location of the close inside the recent range. It is used with the rotation score to see whether finishes are still leaning with a directional phase or backing off.
Session analysis is an end-of-day read that compares overlay shape, rotation, and close location. That comparison classifies the current session as rotation inside a bracket or continuation after a break.
Bracket, break, and a later equilibrium
The illustrated overlay process locates a bracketing equilibrium, records a breakout, follows the later directional phase, and then waits until a new equilibrium forms.
In the illustrated overlay, equilibrium limits sat near 9008 and 8820. Prints above the upper bound flagged an upside break. Prints below the lower bound flagged a downside alert. Activity remaining inside those limits added to the equilibrium.
After two added sessions formed a second distribution near 8808 with low rotation, a break below 8820 was read as the start of a directional phase. That break was treated as confirmed no later than the second session close.
A large counter-move back into the prior bracket did not cancel the downside condition while the rotation score stayed below 0.6 and the upper bracket limit was not broken.
Pauses in a decline and a new bracket
During the decline, consolidations near 8804, 8716, 8620, and 8420 typically showed the four-day rotation score briefly shifting from trend toward rotation. The close quadrant backed off from four toward two or three.
After 8408 was reached a second time without further penetration, rotation rose sharply, including a four-day reading of 0.83. The next session closed in quadrant one. A rally then persisted into a new bracket near 8620 with limits near 8708 and 8600.
September 1988 T-bond overlay: TPO count by price
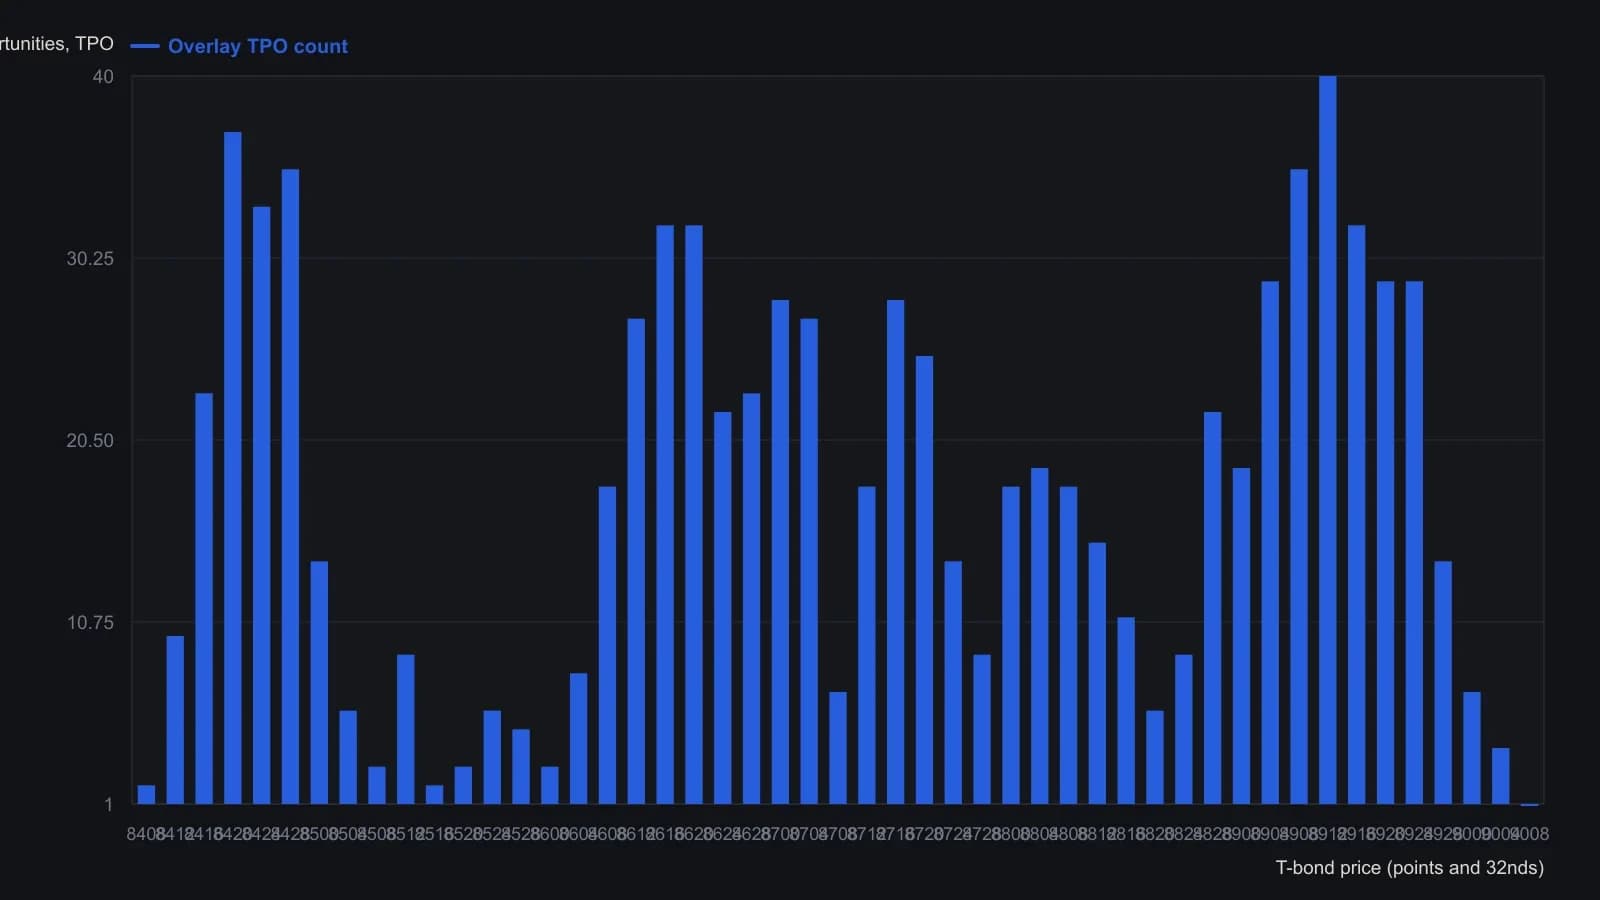
Prices are CBOT T-bond quotes in points and 32nds (9008 means 90-08). The source printed 8800 on two successive rows (TPO 16 over 3 days, then TPO 18 over 4 days); the later four-day count is plotted.
What the construction is not
The overlay construction is presented as a daily condition read specific to the present auction. It is not presented as a fitted trading model. It is not presented as a long-sample average of market behavior.
All readings on this track · 20 readings
- 1987Intraday Value Area construction from TPO counts
- 1987Constructing session market profiles from half-hour auctions
- 1988Volume value area versus time-print filters
- 1988Auction control from a price, volume, and time ledger
- 1988Constructing intraday trade-facilitation percentile tables
- 1988Constructing session decisions from auction age and volume
- 1989Range extension after the opening auction
- 1989Constructing value maps from auction volume overlays
- 1989The bull hook as a next-session opening-range breakout filter
- 1990Incomplete volume-at-price samples and auction reads
- 1990Constructing overlay profiles to map auction value
- 1990Constructing daily overlay profiles for auction brackets and breaks
- 1990Volume-confirmed facilitation as an execution gate for half-hour breakouts
- 1992Volume-box construction with named spreadsheet macros
- 1993Commercial volume caps outside the value area
- 1993Hourly participant volume as a live filter for day trades
- 1999Assembling the daily auction from time-price opportunities
- 2000Who accepted price first in the auction
- 2002Treat the session as an auction: find value, then judge the breakout
- 2002Auction structure, trader constraints, and the opening range