1987issue C081-4
Intraday Value Area construction from TPO counts
The official Value Area is marked after the close as the 70% range of daily volume. Before that overlay is available, a session estimate can be rebuilt from accumulating TPO counts by expanding from the highest time-at-price until 70% of the peak count is enclosed.
- The official Value Area is computed after the close by overlaying traded volume on the completed price-time profile and marking the 70% range of daily volume.
- A session estimate substitutes TPO counts for printed volume at each traded price and can be refreshed as new half-hour blocks print.
- Construction starts at the highest TPO count and adds mass on alternate sides of that center until 70% of the peak count is enclosed.
- A Value Area that widens on rising volume is read as the auction facilitating trade; a range that narrows on falling volume is read as a warning of change.
The official mark waits for the close
The official Value Area is computed after the close by overlaying traded volume on the completed price-time profile and marking the 70% range of daily volume. That overlay is the volume profile: the same price ladder with traded volume at each tick.
A session estimate can be built before the close by substituting TPO counts for printed volume at each traded price. The substitution leaves a usable 70% activity range while the official volume report is still unavailable.
TPO counts keep the map current
Market Profile records each traded price together with the half-hour TPO block in which it printed, so the distribution can be updated throughout the session rather than only after the close.
A TPO is a time-price opportunity: a half-hour block in which a given price traded, counted as time spent at that price. The finished session map often finishes as a bell-shaped distribution of time-at-price.
Construction from the modal price
Construction starts at the price with the highest TPO count, then adds TPO mass on alternate sides of that center until 70% of the peak TPO count is enclosed. The enclosed prices are the estimated Value Area.
The result is a contiguous price range that concentrates the designated share of session activity. After the close, that same idea is marked as the 70% range of daily volume.
TPO count by price as the 6 February 1987 T-bond session builds
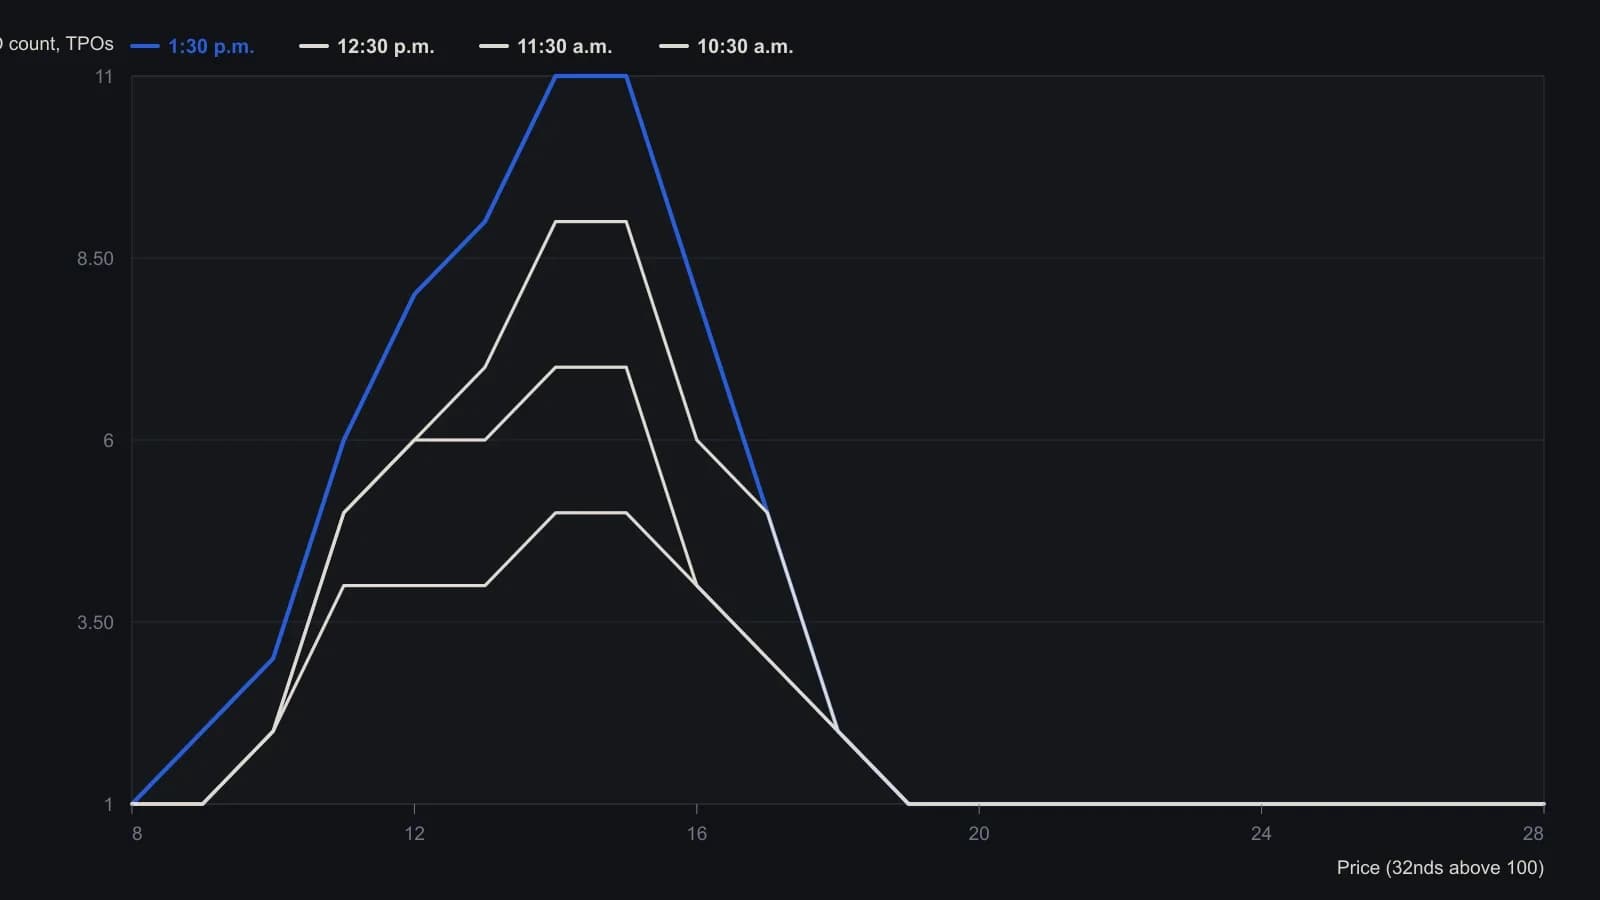
Letter strings were counted at each price. The 100 13/32 cell at 1:30 p.m. is 9 prints (B–H, J, K): period I never printed there at 12:30, and that count is what makes the ladder total the printed 76 TPOs.
Facilitating trade and a narrowing range
A Value Area that widens over several days on rising volume is read as the auction facilitating trade. A Value Area that narrows on falling volume is read as a warning of change.
Facilitating trade is the auction state inferred when breadth of range and depth of activity are sufficient to meet two-sided demand. A narrowing Value Area on falling activity is treated as a sign of change.
By 1:30 p.m. on 6 February the estimated Value Area span was 6/32 versus 17/32 the prior day, which was taken as evidence the market was no longer facilitating trade. The next session opened lower and closed at 99 19/32.
TPO estimates versus the volume overlay
Recalculating end-of-day Value Areas from TPOs instead of volume placed T-bond estimates within one tick in 57 of 80 cases (71%) and within two ticks in more than 81% of cases.
The same TPO-versus-volume check for soybeans was within one tick in 51 of 76 cases (67%) and within two ticks more than 80% of the time.
All readings on this track · 20 readings
- 1987Intraday Value Area construction from TPO counts
- 1987Constructing session market profiles from half-hour auctions
- 1988Volume value area versus time-print filters
- 1988Auction control from a price, volume, and time ledger
- 1988Constructing intraday trade-facilitation percentile tables
- 1988Constructing session decisions from auction age and volume
- 1989Range extension after the opening auction
- 1989Constructing value maps from auction volume overlays
- 1989The bull hook as a next-session opening-range breakout filter
- 1990Incomplete volume-at-price samples and auction reads
- 1990Constructing overlay profiles to map auction value
- 1990Constructing daily overlay profiles for auction brackets and breaks
- 1990Volume-confirmed facilitation as an execution gate for half-hour breakouts
- 1992Volume-box construction with named spreadsheet macros
- 1993Commercial volume caps outside the value area
- 1993Hourly participant volume as a live filter for day trades
- 1999Assembling the daily auction from time-price opportunities
- 2000Who accepted price first in the auction
- 2002Treat the session as an auction: find value, then judge the breakout
- 2002Auction structure, trader constraints, and the opening range