2006issue C071-3
Wave and ratio checkpoints versus a dominant dollar story
A dollar, euro, and pound case keeps Elliott-wave structure, Fibonacci projections, and point-and-figure counts as independent, fail-able checkpoints when a current-account story dominates the tape.
- A shorter corrective phase inside a labeled downtrend is unfinished business, not automatic proof that the larger trend has ended.
- Leave Fibonacci retracement and projection levels on the map after a headline arrives; closer approaches raise the bar for a dollar-supportive stance rather than erase the count.
- Read listed upside areas as possible medium-term peaks until a downside pattern forms.
- Let Elliott-wave labels, Fibonacci projections, and point-and-figure counts vote separately instead of letting one deficit story rewrite the map.
The larger trend and the corrective phase
EUR/USD and GBP/USD were framed as still being in long-term downtrends. The prior six months were treated as a possible short-term corrective phase: a shorter countertrend swing inside a larger labeled trend.
TradersWeek editorial: that framing keeps the larger Elliott-wave count on the desk. The bounce is unfinished business until the structure itself fails. It is not automatic proof that the downtrend has ended.
Ratios stayed on the map after the headline
Renewed current-account headlines were noted as arriving after GBP/USD reached a 61.8 percent retracement and EUR/USD reached a 50 percent retracement.
The EUR/USD map listed discrete upside reference prices at 1.2849, 1.2883, 1.3169, and 1.3225. Fibonacci references at 61.8 percent and 78.2 percent were described as still active, with closer approaches making a dollar-supportive chart stance harder to keep.
TradersWeek editorial: the sequence is the teaching point. Fibonacci-projection work had already marked candidate turning areas before the deficit story got louder. A second-vote habit leaves those levels in place. If price accepts through the active ratios, the dollar-supportive stance loses its chart case. If it does not, the headline has not rewritten the map.
Sterling turning areas as medium-term peaks
GBP/USD was labeled with Elliott-wave structure and approximate upside turning areas at 1.857, 1.869, 1.890, 1.897, 1.929, and 1.901. Those areas were to be read as possible medium-term peaks until a downside pattern formed.
TradersWeek editorial: a medium-term peak is a pause or turn candidate, not a confirmed reversal. The Elliott-wave count locates where the currency move may still be completing rather than reversing. The next swing structure is what would confirm or reject the label.
Policy mix only as context
A restrictive-rate plus expansionary-fiscal policy mix was cited as a still-plausible path for dollar appreciation, even while current-account warnings remained widespread.
TradersWeek editorial: policy mix is only context for why a chart thesis might persist after a popular deficit story. It does not replace the Elliott-wave, Fibonacci-projection, or point-and-figure checkpoints.
Convergence on the euro-sterling map
EUR/GBP long-term references for a wave-5 peak were given as 0.745, 0.75, 0.755, 0.795, and 0.81. Added weight was said to come from Fibonacci-extension and point-and-figure count convergence.
TradersWeek editorial: a ratio cluster is a zone where more than one Fibonacci or measured-move reading lands near the same level. Point and figure is used here as a time-independent box-and-reversal count, a second measured objective that can confirm or reject a ratio target. Convergence raises the bar for what would invalidate the map. It does not make the map immune to later price.
A wave reading versus the prevailing story
The case set a wave-and-ratio reading of later dollar strength versus the euro and pound against a then-prevailing media view that the dollar should keep falling.
TradersWeek editorial: the archive records a historical workflow, not a verdict on later markets. The habit worth keeping is to let structure, ratios, and box counts vote independently when one macro story dominates the tape.
GBP/USD daily close at the 61.8 percent retracement
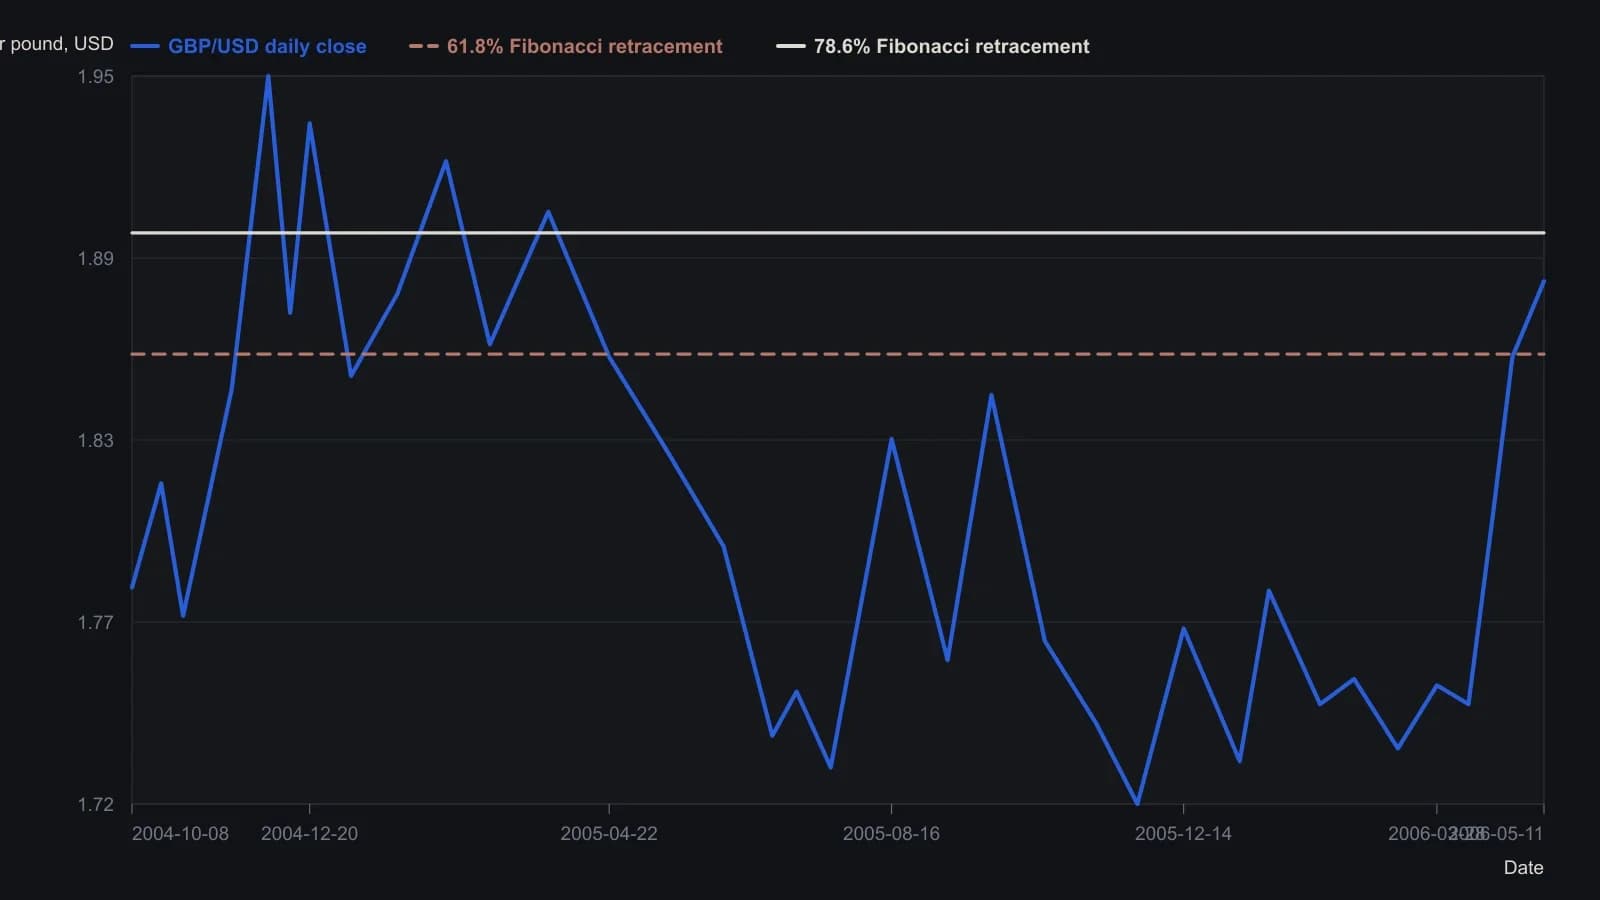
The price path is digitized from the 11 May 2006 daily-close raster, so swing dates are approximate to the nearest half-month. Fibonacci prices 1.8589 and 1.8973 are the chart's own labels. The article text calls the upper ratio 78.2 percent.
All readings on this track · 18 readings
- 2001Constructing a Gartley from wave retracements
- 2001Constructing butterfly-spreads from a weekly impulse to daily D
- 2002Projected Fibonacci targets from breakout levels
- 2004Constructing wave-ratio clusters with Fibonacci and Gann
- 2006Third-wave impulse counts wait for a dated cluster
- 2006Wave and ratio checkpoints versus a dominant dollar story
- 2007A 2007 EUR/JPY news shock as a Fibonacci retest drill
- 2008Constructing Fibonacci retracement, projection, and range maps
- 2010Swing projection targets and support-backed put sales
- 2010Fibonacci clusters as a tight support or resistance decision
- 2011Fibonacci projections and money-flow divergence on a Dollar Index downswing
- 2011Crude oil wave confluence as a decision map
- 2016Box range projections for cup breakout entries
- 2018Fibonacci pinball and the 2016 election-week scoring drill
- 2019Named line-break rules for a wave count and Fibonacci map
- 2019Objective Fibonacci grids for support, retracement, and projection
- 2020Gold Super Cycle nested waves and Fibonacci bands
- 2020Intra-swing Fibonacci fitting and completion targets