2011issue C0156-59
Fibonacci projections and money-flow divergence on a Dollar Index downswing
On a daily Dollar Index chart, one measured AB swing-length was turned into a stack of Fibonacci projections that later price could invalidate. Money-flow and oscillator divergence were logged as an early reversal warning and left uncalled until later price structure confirmed or failed the idea.
- Swing AB of 8.63 points, scaled by 0.618 from point C at 83.635, projected a CD end at 78.30 that later price exceeded.
- The same swing formula at 0.786 printed 76.85, just above a marked support band from 76.80 to 76.00. If that zone failed, the next specified multiples were 1.00 and 1.272.
- A 34-period Chaikin money-flow line and a detrend oscillator both failed to confirm a still-falling index, and that divergence was treated as a warning that still needed later price confirmation.
- After the bounce, a 3.47-point swing added to 76.335 projected 79.80, nearly matching a 50 percent Fibonacci retracement of swing BC at 79.70.
What the chart was asked to do
The archive case uses the daily Dollar Index as one measured downswing. The working unit is swing-length: the point distance between two labeled swing extremes used as the input for ratio arithmetic.
Fibonacci projection is applied first. A Fibonacci multiple of an earlier swing length is taken from a later origin to estimate where the active swing may end. Those prints are support and resistance levels that later bars can pass through, which is how the hypothesis is invalidated.
Fibonacci retracement appears after the bounce. It is a stated fraction of a completed swing used to mark where a later counter-move may stall. Divergence is kept separate: a split between a new price extreme and an indicator that fails to confirm it, treated as a warning until later price action agrees.
Projecting the CD leg from swing AB
On the daily chart, swing AB measured 8.63 points. A 0.618 multiple of that length, subtracted from point C at 83.635, produced a projected CD termination of 78.30.
After that first projected level was exceeded, the same swing formula with a 0.786 ratio produced 76.85, just above a marked support band from 76.80 to 76.00. If the zone near 76.00 failed, the next Fibonacci multiples specified for the same swing equation were 1.00 and 1.272.
Fibonacci CD support stack from the Dollar Index AB swing
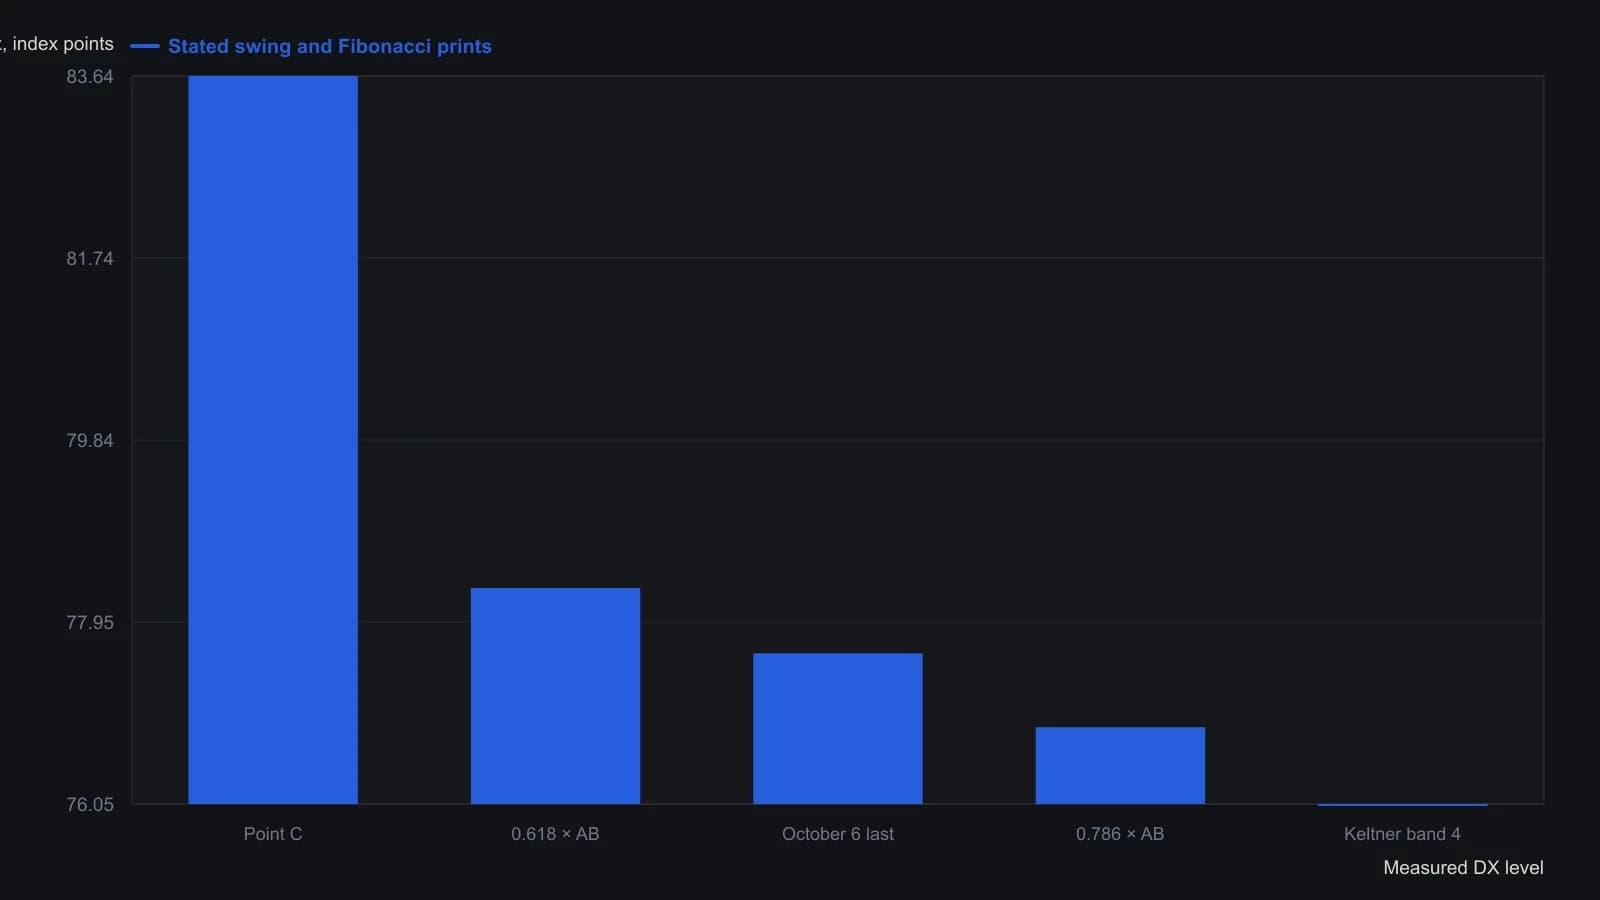
Keltner bands were plotted 4.2 and 7.5 standard deviations from a 45-period EMA. The article left 1.00 and 1.272 extensions uncomputed unless 76.00 also failed.
Divergence held as a warning
A 34-period Chaikin money-flow line was read as bullish divergence versus a still-falling Dollar Index and labeled an early reversal warning that required later price confirmation.
A detrend oscillator held successive lows at a similar level while the Dollar Index continued lower. That reading was treated as a second nonconfirmation of the decline.
Retracements and projections after the bounce
After the bounce, a 3.47-point AB swing added to 76.335 projected 79.80, nearly matching a 50 percent Fibonacci retracement of swing BC at 79.70.
A 62 percent Fibonacci retracement of the same decline sat at 80.63. Extending the 3.47-point swing by 1.618 from 76.335 produced 81.95 as a farther pause zone.
The larger decline and later overhead tests
From 89.165 on 8 June 2010 to 75.235 on 3 November 2010 the index fell 15.62 percent in under five months, then printed an interim low slightly through the earlier 76.00 hypothesis.
A later daily update placed the first overhead test near 80.17 at Fibonacci 62 percent resistance and a second band at 81.60 to 82.00 where a Fibonacci 79 percent level overlapped a Keltner band. That overlap is confluence: an overlap between a Fibonacci print and another independently drawn support or resistance band.
Editorial reading of the workflow
Editorial interpretation: the useful object in this case is not a single preferred ratio. It is a measured length that can be restated as 0.618, 0.786, 1.00, and 1.272 until price accepts or rejects the zone. The 78.30 print was exceeded, so the hypothesis moved down the stack rather than being defended.
Editorial interpretation: money-flow and detrend nonconfirmation stayed in the warning column. The later bounce, the interim low slightly through 76.00, and the overhead tests near 80.17 and 81.60 to 82.00 are the price-structure checks that the archive workflow itself required before a reversal reading could be treated as confirmed.
Editorial interpretation: the near match of 79.80 and 79.70, and the later overlap of a Fibonacci 79 percent print with a Keltner band, are confluence checks. They do not convert the workflow into a tested trading system.
All readings on this track · 18 readings
- 2001Constructing a Gartley from wave retracements
- 2001Constructing butterfly-spreads from a weekly impulse to daily D
- 2002Projected Fibonacci targets from breakout levels
- 2004Constructing wave-ratio clusters with Fibonacci and Gann
- 2006Third-wave impulse counts wait for a dated cluster
- 2006Wave and ratio checkpoints versus a dominant dollar story
- 2007A 2007 EUR/JPY news shock as a Fibonacci retest drill
- 2008Constructing Fibonacci retracement, projection, and range maps
- 2010Swing projection targets and support-backed put sales
- 2010Fibonacci clusters as a tight support or resistance decision
- 2011Fibonacci projections and money-flow divergence on a Dollar Index downswing
- 2011Crude oil wave confluence as a decision map
- 2016Box range projections for cup breakout entries
- 2018Fibonacci pinball and the 2016 election-week scoring drill
- 2019Named line-break rules for a wave count and Fibonacci map
- 2019Objective Fibonacci grids for support, retracement, and projection
- 2020Gold Super Cycle nested waves and Fibonacci bands
- 2020Intra-swing Fibonacci fitting and completion targets