2006issue C051-5
Third-wave impulse counts wait for a dated cluster
Until the third swing finishes, this case study labels the opening impulse as wave 1/A and the first correction as wave 2/B. Editorial note: those delayed labels, plus dated Fibonacci extensions and retracements, turn the third swing into a cluster zone the next bar can accept or reject.
- Until the third swing finishes, treat the opening impulse as wave 1/A and the first correction as wave 2/B, because the larger pattern is not yet impulsive or corrective.
- If the five lesser-degree subwaves are not visible on the working chart, drop to a shorter time frame before labeling.
- Project wave extensions only after the EOW2 bar and the EOW4:W3 bar, then watch for independent Fibonacci levels to stack into a cluster zone.
- Editorial reading: once wave 3/C can be classified, convert the dated cluster into price levels the next bar can accept or reject.
A five-wave impulse still waits for the third swing
The case study frames crowd behavior as a repeating impulse pattern: a five-wave advance, W1 through W5, followed by a three-wave correction, A-B-C. Both types nest into lesser-degree subwaves.
Until the third swing finishes, the opening impulse is treated as wave 1/A and the first correction as wave 2/B. The pattern cannot yet be classified as impulsive or corrective. Wave 3/C is the swing the case study watches most closely, because that third swing is what distinguishes an impulse, wave 3, from a correction, wave C.
The alternation principle is used here to expect a corrective wave 2/B after the first impulse. If the required five lesser-degree subwaves are not visible on the working chart, the study drops to a shorter time frame before labeling.
Projections start only on two authorized bars
Wave extensions are Fibonacci multiples of a completed prior wave, projected from a later origin such as the end of W2 or the low of a nested fifth wave. Those projections are timed only after specified bars: the end of W2 and the end of nested w4:W3.
The EOW2 bar is the trading-time-frame bar that completes primary wave 2 and is the first authorized moment to project W3 extensions. The EOW4:W3 bar is the bar that completes the nested fourth wave inside wave 3 and is the authorized moment to project the nested fifth-wave targets.
On the illustrated five-minute DAX chart, a typical impulse is annotated with W2 equal to 0.50 of W1, W3 equal to 5.5 of W1, and W4 equal to 0.786 of W3, with W5 of the larger W1 through W5 still in progress.
Nested fifth-wave endings inside wave 3 are projected from the low of w5:W3 using 1.272 and 1.618 of primary W1, plus 1.618, 2.618, and 4.236 of primary W2.
A 12-level cluster on the five-minute DAX chart
In the worked example, independent extensions and retracements stacked into a 12-level cluster zone spanning 4139.5 to 4144.5. That five-point band is described as 0.12% of the W3 market price and 10.76% of W3 length.
Cluster members included 4.236 of W1 near 4142, 1.000 of w1:W3 near 4139.5, 0.500 of w3:W3 with 1.272 of W1 near 4140, 0.382 of w1-3:W3 near 4140.5, 4.236 of W2 near 4141, 1.272 of w1:W3 with 4.236 of w2:W3 near 4143, 0.618 of w3:W3 near 4143.5, 2.618 of w4:W3 with 1.618 of W1 near 4144, and 0.500 of w1-3:W3 near 4144.5.
The observed W3 high completed at 4142, which the write-up locates at the midpoint of that cluster.
Twelve Fibonacci targets cluster on the DAX wave-3 high
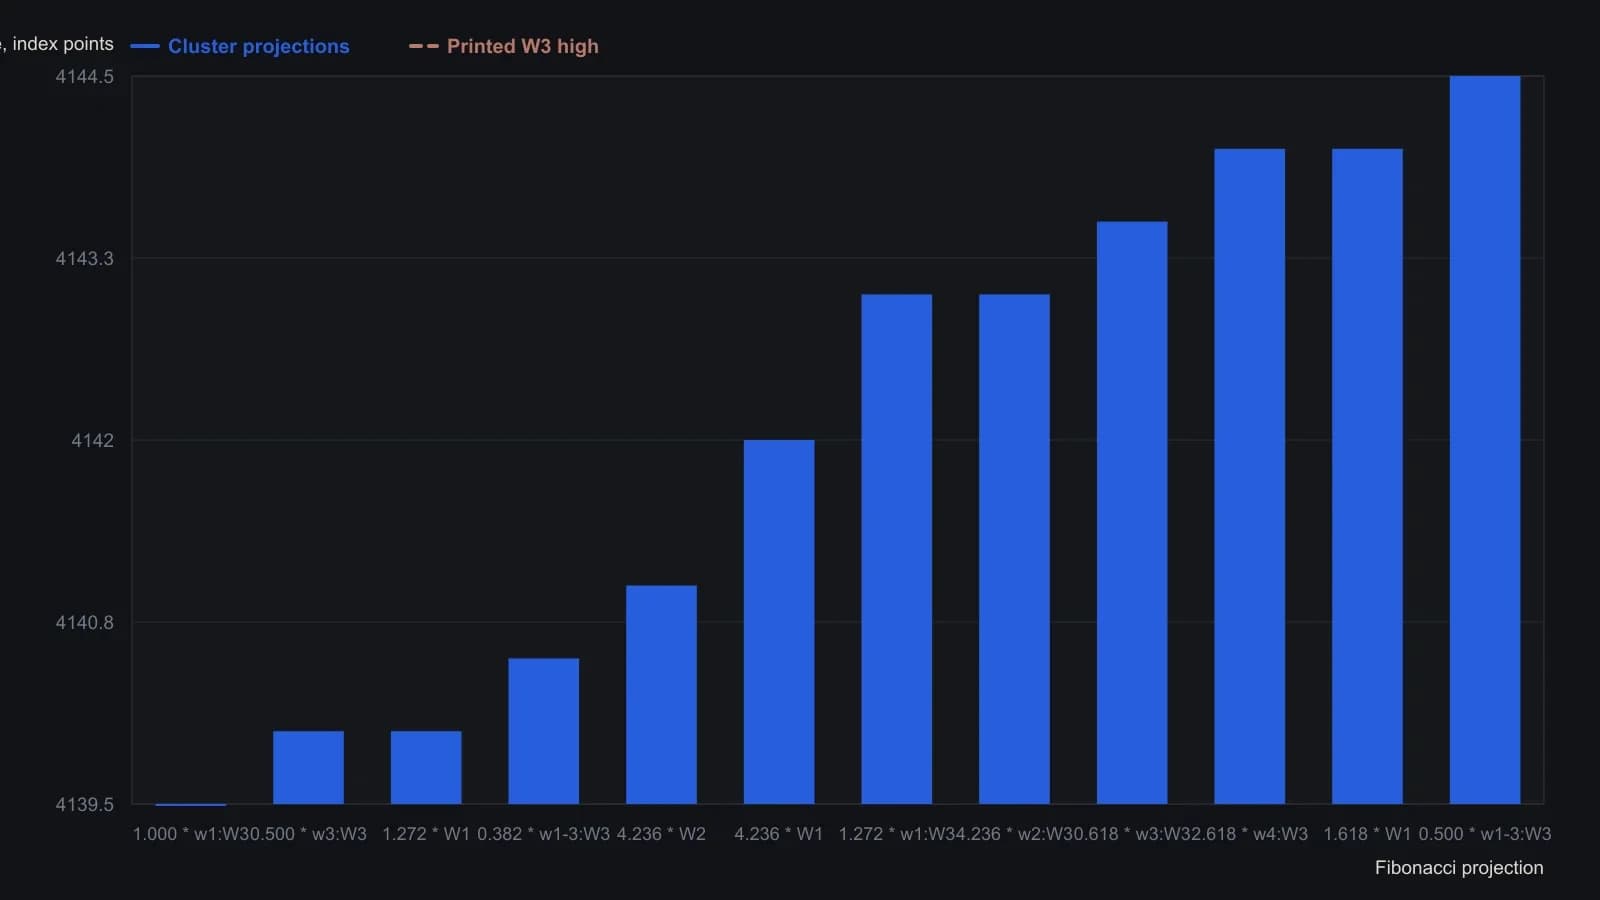
Projections are applied only at the end of W2 and at the end of w4:W3. Dual-ratio hits at the same price are counted as two of the twelve levels. The sidebar also prints Fisher variants, which this band omits. The five-point width is 0.12 percent of the W3 market price and 10.76 percent of the W3 length.
All readings on this track · 18 readings
- 2001Constructing a Gartley from wave retracements
- 2001Constructing butterfly-spreads from a weekly impulse to daily D
- 2002Projected Fibonacci targets from breakout levels
- 2004Constructing wave-ratio clusters with Fibonacci and Gann
- 2006Third-wave impulse counts wait for a dated cluster
- 2006Wave and ratio checkpoints versus a dominant dollar story
- 2007A 2007 EUR/JPY news shock as a Fibonacci retest drill
- 2008Constructing Fibonacci retracement, projection, and range maps
- 2010Swing projection targets and support-backed put sales
- 2010Fibonacci clusters as a tight support or resistance decision
- 2011Fibonacci projections and money-flow divergence on a Dollar Index downswing
- 2011Crude oil wave confluence as a decision map
- 2016Box range projections for cup breakout entries
- 2018Fibonacci pinball and the 2016 election-week scoring drill
- 2019Named line-break rules for a wave count and Fibonacci map
- 2019Objective Fibonacci grids for support, retracement, and projection
- 2020Gold Super Cycle nested waves and Fibonacci bands
- 2020Intra-swing Fibonacci fitting and completion targets