2007issue C111-2
A 2007 EUR/JPY news shock as a Fibonacci retest drill
On 17 August 2007, euro versus Japanese yen dropped more than 300 points in one hour after the Nikkei fell more than 800 points. This archive article restates that session as a three-step classroom walk-through: measure the news impulse, grade a stall at the 38.2% Fibonacci retracement as a failed news-retracement, then stage a double-bottom retest and a 138.2% Fibonacci projection.
- After a large economic surprise, the first bounce is more often a news-retracement than a genuine reversal.
- In that 17 August 2007 session, price stalled at 153.58, the 38.2% Fibonacci retracement of the immediate downswing.
- Strongly positive or negative news can keep influencing currency prices beyond the first print, so follow-through is treated as a continuation problem.
- One staging plan covered half at the 151.93 double-bottom retest, moved the remainder to breakeven, and left the rest toward the 138.2% Fibonacci projection beyond 150.38.
The first bounce after the shock
On 17 August 2007, euro versus Japanese yen dropped more than 300 points in one hour after the Nikkei fell more than 800 points. In this archive article, euro versus Japanese yen is used as a risk-appetite carry-trade proxy.
After a large economic surprise, the first bounce is more often a retracement than a genuine reversal. That first counter-move is a news-retracement: the first counter-move after a large surprise, often inventory-driven rather than a trend change.
Measure the news impulse
Strongly positive or negative news can keep influencing currency prices beyond the first print, so the follow-through is treated as a continuation problem rather than a finished event. The working swing is the immediate downswing that followed the shock.
TradersWeek editorial framing treats that measurement as the first classroom step, taken before the bounce is graded as a pause or a reversal.
Grade the 38.2% stall
In that session, price stalled at 153.58, the 38.2% Fibonacci retracement of the immediate downswing. A Fibonacci retracement of a news-driven swing is used to test whether the first bounce is a pause or a reversal.
TradersWeek editorial interpretation: the stall is graded as a failed news-retracement, not as a sign that the shock move had reversed.
Stage the retest and the projection
The first measured objective was a return to the 151.93 low printed at 07:00 that day, framed as a double-bottom style retest of the breakdown extreme. Double top and bottom is treated here as a retest of the shock extreme after an abrupt fundamental change.
A Fibonacci projection of the original down segment carried price beyond 150.38, the 138.2% extension of that swing. A Fibonacci projection of the original impulse is used to map continuation beyond the first retest. News-driven continuation can outrun a simple double-bottom retest, which is why a 138.2% Fibonacci projection was used as a second measured level.
One staging plan used two units: cover half at the double-bottom retest, move the remainder to breakeven, and leave the rest toward the 138.2% projection.
EUR/JPY Fibonacci map after the 17 August 2007 news shock
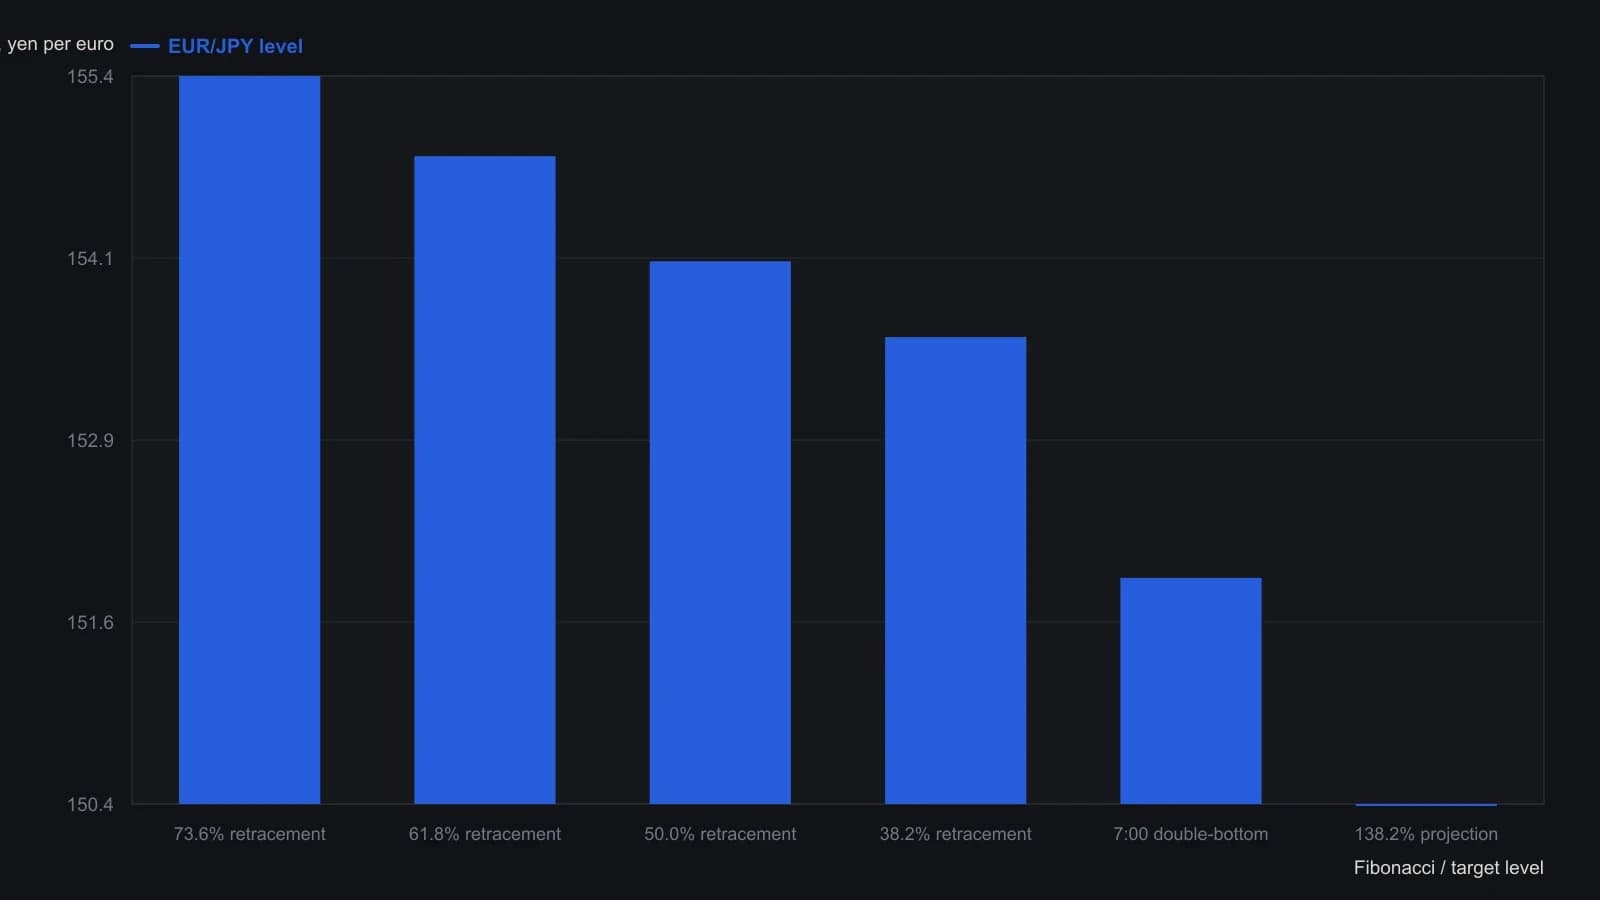
Higher retracement yields are taken from the labels printed on the 1-hour chart. The 7:00 low and the 138.2 percent projection are the figures given in the prose, not recomputed from the candles.
All readings on this track · 18 readings
- 2001Constructing a Gartley from wave retracements
- 2001Constructing butterfly-spreads from a weekly impulse to daily D
- 2002Projected Fibonacci targets from breakout levels
- 2004Constructing wave-ratio clusters with Fibonacci and Gann
- 2006Third-wave impulse counts wait for a dated cluster
- 2006Wave and ratio checkpoints versus a dominant dollar story
- 2007A 2007 EUR/JPY news shock as a Fibonacci retest drill
- 2008Constructing Fibonacci retracement, projection, and range maps
- 2010Swing projection targets and support-backed put sales
- 2010Fibonacci clusters as a tight support or resistance decision
- 2011Fibonacci projections and money-flow divergence on a Dollar Index downswing
- 2011Crude oil wave confluence as a decision map
- 2016Box range projections for cup breakout entries
- 2018Fibonacci pinball and the 2016 election-week scoring drill
- 2019Named line-break rules for a wave count and Fibonacci map
- 2019Objective Fibonacci grids for support, retracement, and projection
- 2020Gold Super Cycle nested waves and Fibonacci bands
- 2020Intra-swing Fibonacci fitting and completion targets