2010issue C1344-49
Fibonacci clusters as a tight support or resistance decision
A Fibonacci price cluster is at least three retracement, projection, and expansion readings from different swings that land in a tight range. Archive cases treat that overlap as a support or resistance decision and wait for a shorter-interval hold before seeking a trigger.
- A price cluster is at least three Fibonacci price relationships from different swings that coincide in a relatively tight range and mark a support or resistance decision.
- After price holds above a support cluster or below a resistance cluster, the next step is a buy or sell trigger rather than an automatic entry at the Fibonacci number.
- A two-step zigzag seeks a 0.618 retracement overlapping a 1.272 extension and a 100% projection; if it holds, the hypothesis is continuation of the first swing, not a five-wave Elliott count.
- The more defined setup is when time and price coincide and a trigger chart then gives an entry signal.
What a Fibonacci price cluster is
A Fibonacci price cluster is defined as at least three Fibonacci price relationships from different swings that coincide inside a relatively tight range and mark a support or resistance decision. Those relationships are built from a Fibonacci retracement of a prior swing, commonly 0.618 or 0.786 of that swing; a Fibonacci projection that copies a prior swing, often as a 100% measured move from a later high or low; and a Fibonacci expansion that extends a swing beyond its origin, commonly 1.272 or 1.618. Each reading is one input to the same support or resistance band.
Editorial reading: a three-layer geometry problem
Editorial reading: treat the trade idea as a three-layer geometry problem. First mark overlapping Fibonacci retracement, projection, and expansion readings from different swings. Next require that overlap to sit in a tight price band. Then wait for a shorter-timeframe hold before calling the zone a decision rather than a forecast. The archive facts describe that historical workflow. They do not turn the cluster itself into an automatic order.
The March S&P support band
In the March S&P example, a 1.272 relationship at 1122.50, a 100% projection at 1123.50, and a 0.618 retracement at 1124.50 formed a tight 1122 to 1124 band treated as an important support decision. Risk on the S&P example is framed as three points, with partial exits at key levels and a trailing stop toward a major target.
Two-step zigzag and the gold clusters
A two-step zigzag setup is a two-leg correction of a prior swing that seeks an overlap of specific ratios, ideally a 0.618 retracement coinciding with a 1.272 extension of the zigzag and a 100% projection of the first swing of that zigzag. If a two-step zigzag correction plays out, the hypothesis is continuation in the direction of the first swing that the zigzag was correcting, not a standalone five-wave Elliott count.
In the gold two-step example, a 0.786 retracement, a 100% projection, and a 1.618 extension clustered at 1101.10 to 1103.00. A second, non-two-step cluster at 1092.60 to 1095.30 combined a 100% projection, a 0.786 retracement of a larger swing, and a 1.618 extension. If those gold zones are tested and hold, entry is sought on a trigger chart, typically as low as a five-minute interval for initial entry. Holding beyond levels on a 15-minute chart is the stated condition for keeping a position overnight.
A symmetry setup
A symmetry setup projects a prior corrective decline from a new high in an uptrend, and the reverse in a downtrend, as a measured move used to re-enter with the larger trend.
Markets that can carry the method
The method is applied to stock indexes, individual equities, forex, gold, crude, and grains when the series has enough history and swing highs and lows. Thin penny names and markets without meaningful swing data are treated as unusable.
Time, trigger charts, and the stated risk frame
Time levels can be violated just as price levels can. The more defined setup is when time and price coincide and the market then gives an entry signal. A trigger chart is a shorter interval, often five minutes for initial entry, used only after the higher-timeframe cluster has been defined and the market is holding the decision.
March wheat daily price testing the Fibonacci support cluster
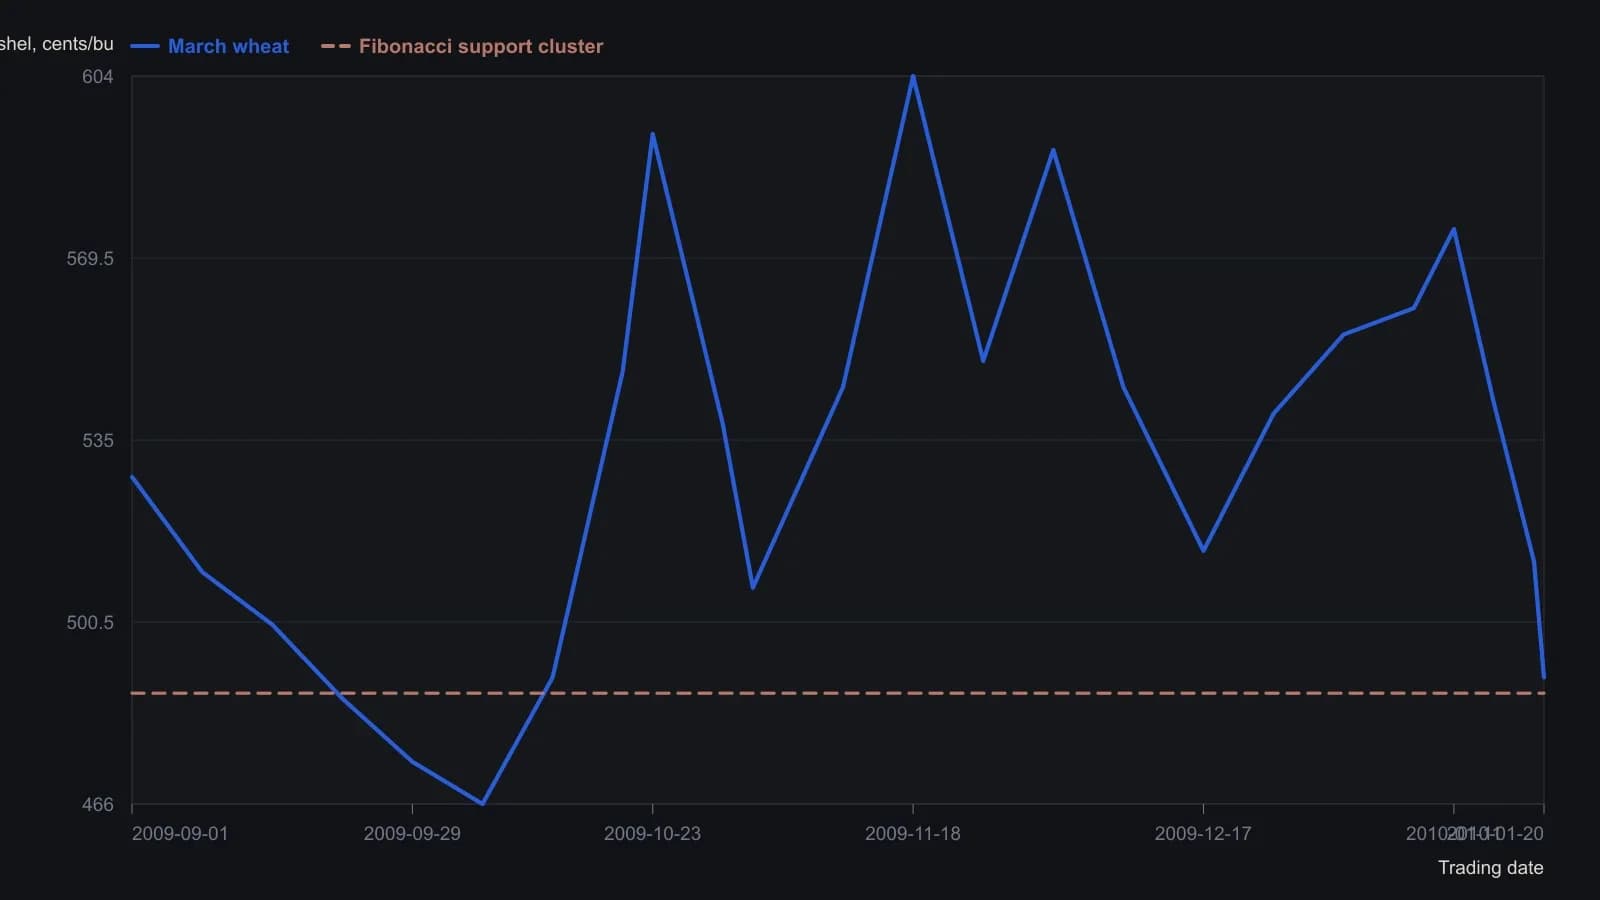
Intermediate points are approximate to the nearest few cents because the raster is a five-month daily view with 50-cent grid lines. Wheat is quoted in cents and eighths. Magazine callouts beside the figure also list a 1.000 projection at 484 2/8, a 1.272 extension at 481 2/8 and a 1.616 addition at 476 2/8, just under the drawn band.
All readings on this track · 18 readings
- 2001Constructing a Gartley from wave retracements
- 2001Constructing butterfly-spreads from a weekly impulse to daily D
- 2002Projected Fibonacci targets from breakout levels
- 2004Constructing wave-ratio clusters with Fibonacci and Gann
- 2006Third-wave impulse counts wait for a dated cluster
- 2006Wave and ratio checkpoints versus a dominant dollar story
- 2007A 2007 EUR/JPY news shock as a Fibonacci retest drill
- 2008Constructing Fibonacci retracement, projection, and range maps
- 2010Swing projection targets and support-backed put sales
- 2010Fibonacci clusters as a tight support or resistance decision
- 2011Fibonacci projections and money-flow divergence on a Dollar Index downswing
- 2011Crude oil wave confluence as a decision map
- 2016Box range projections for cup breakout entries
- 2018Fibonacci pinball and the 2016 election-week scoring drill
- 2019Named line-break rules for a wave count and Fibonacci map
- 2019Objective Fibonacci grids for support, retracement, and projection
- 2020Gold Super Cycle nested waves and Fibonacci bands
- 2020Intra-swing Fibonacci fitting and completion targets