2018issue C0226-28
Fibonacci pinball and the 2016 election-week scoring drill
A 2016 wave case set a common political script for equities and gold against a map that looked for an equity advance and a gold decline either way. The editorial focus is the pinball drill: after waves one and two, Fibonacci rails and phi projections score a headline week as a third-wave continuation or a failed setup.
- After waves i and ii are complete, Fibonacci retracement rails and 1.618 projections turn a headline week into a third-wave continuation test or a failed setup.
- Social-mood is treated as the filter that interprets headlines, which is offered as the reason prices can rise on negative news and fall on positive news.
- Fibonacci pinball projects later subwaves of waves three through five from Fibonacci extensions of the first two waves.
- By early November 2016 the S&P 500 was placed in a third-wave with named confirmation and objective levels, while metals used a zero-six-one-eight-rail as the line in the sand.
Two maps of the same election week
A common 2016 election script tied an equity rally and a gold decline to one political outcome and the reverse path to the other. The wave-and-sentiment reading looked for an equity advance and a gold decline either way.
The case study treats social-mood as the filter that interprets headlines. That framing is offered as the reason prices can rise on negative news and fall on positive news.
From Fibonacci numbers to wave rails
Price is described as zigzagging inside channels and stalling at Fibonacci levels, then using those same ratios to project later Elliott subwaves.
Each Fibonacci number is the sum of the two before it. Consecutive ratios approach 1.618 and 0.618 as the sequence lengthens. Those ratios are labeled phi and applied to wave targets.
How Fibonacci pinball is drawn
Once waves i and ii are complete, later subwaves of waves three through five are projected from Fibonacci extensions of those first two waves. That stepwise path is nicknamed Fibonacci pinball: later Elliott subwaves mapped from those extensions, pictured as price caroming between ratio rails.
A classic five-wave advance is drawn as impulse-and-correction, with five-wave impulses and three-wave corrections. Each subwave is given a phi-derived objective.
The S&P 500 third-wave map
By early November 2016 the S&P 500 was placed in a third-wave, the middle impulse in a five-wave advance and the segment treated as the strongest. Levels 2098 and 2125 were named as the marks that would argue a longer-term low was in place, and 2350 was the next mapped objective.
The chart narrative records the S&P 500 crossing 2098 on 7 November 2016, reaching the 2350 objective by mid-February 2017, dipping in mid-April 2017, and later referencing a 2611 objective.
Metals and the zero-six-one-eight-rail
The metals note treated a break of the 0.618 extension near 25, then follow-through below 25.47, 24.42, and 23.90, as a downside setup. That 0.618 projection is the zero-six-one-eight-rail used as the line in the sand for a fourth-wave metals pullback.
The note recorded a late-December 2016 print below 19 in the stated bottoming region.
Editorial note on the scoring drill
TradersWeek editorial: the pinball drill is a scoring habit, not a campaign forecast. After waves one and two are complete, Fibonacci retracement rails and phi projections keep the headline week attached to a falsifiable third-wave path. The archive records the 2016 map and the later prints. It does not claim that the election script caused those prints.
S&P 500 2016 calls versus later Fibonacci targets
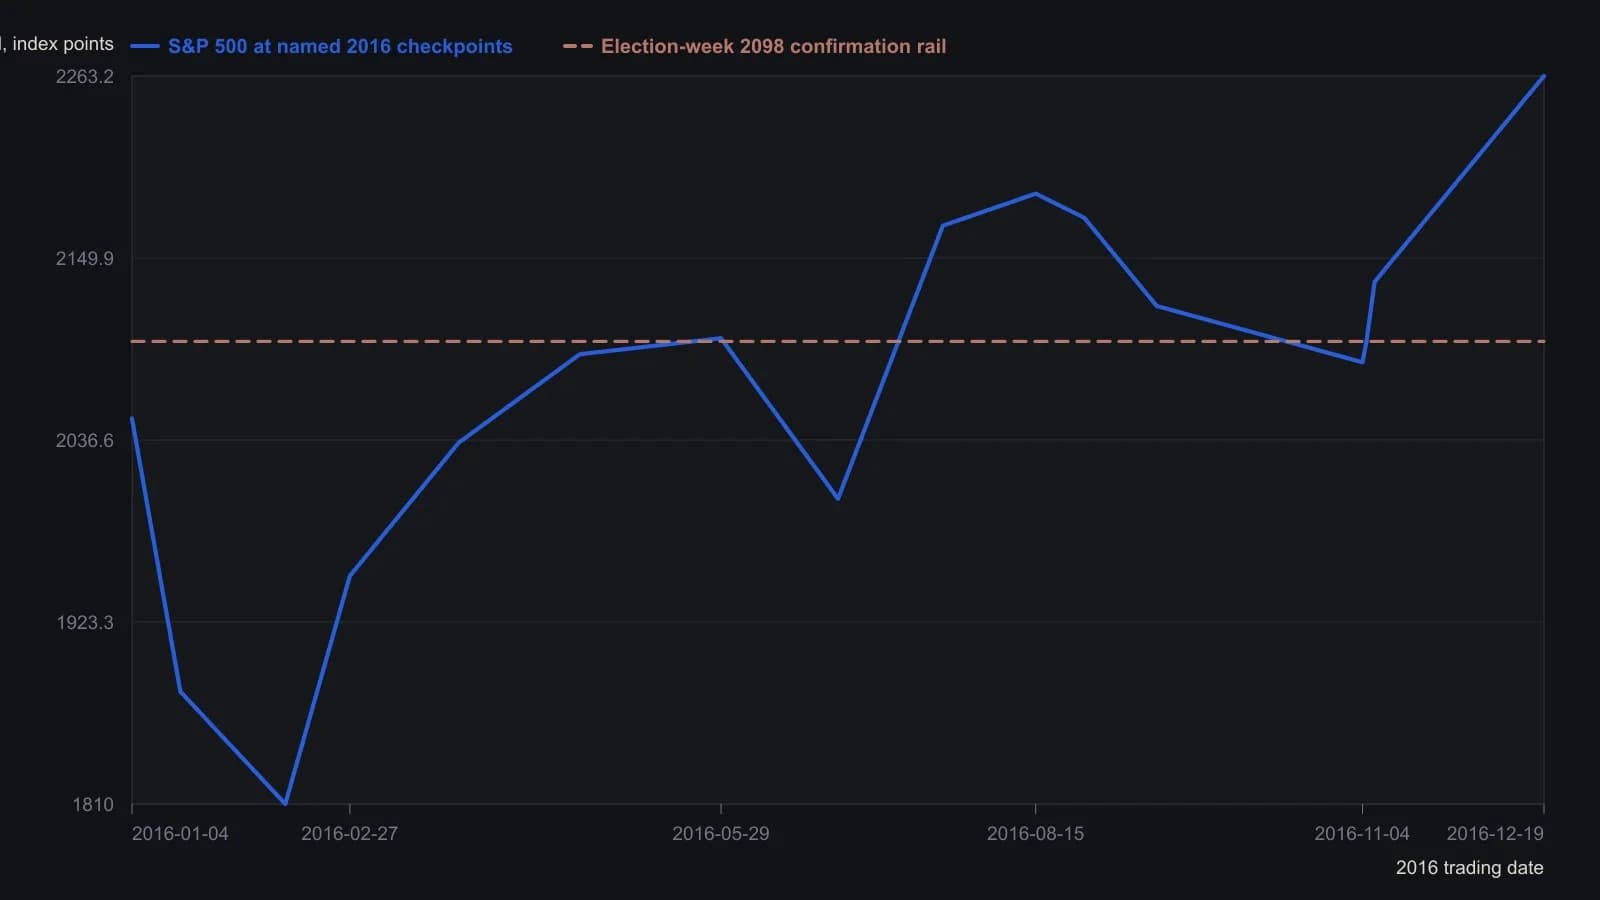
Daily path is a coarse reconstruction from headline levels named in the text and on the annotated chart; intermediate wiggles between those dates are not recovered. The 2611 target is the later objective named in the article, not a 2016 print.
All readings on this track · 18 readings
- 2001Constructing a Gartley from wave retracements
- 2001Constructing butterfly-spreads from a weekly impulse to daily D
- 2002Projected Fibonacci targets from breakout levels
- 2004Constructing wave-ratio clusters with Fibonacci and Gann
- 2006Third-wave impulse counts wait for a dated cluster
- 2006Wave and ratio checkpoints versus a dominant dollar story
- 2007A 2007 EUR/JPY news shock as a Fibonacci retest drill
- 2008Constructing Fibonacci retracement, projection, and range maps
- 2010Swing projection targets and support-backed put sales
- 2010Fibonacci clusters as a tight support or resistance decision
- 2011Fibonacci projections and money-flow divergence on a Dollar Index downswing
- 2011Crude oil wave confluence as a decision map
- 2016Box range projections for cup breakout entries
- 2018Fibonacci pinball and the 2016 election-week scoring drill
- 2019Named line-break rules for a wave count and Fibonacci map
- 2019Objective Fibonacci grids for support, retracement, and projection
- 2020Gold Super Cycle nested waves and Fibonacci bands
- 2020Intra-swing Fibonacci fitting and completion targets