2016issue C0813
Box range projections for cup breakout entries
A completed high-low box from a bullish cup can estimate how far a later swing breakout is likely to travel before it consolidates or reverses. Later entries can be planned at successive range increments, while projected stall zones are used to skip buys that sit just under anticipated resistance.
- A finished bullish cup can be boxed as a high-low trading range, and that height can be stepped upward from the rim as successive price projections.
- A long is considered on a later session after a gap or breakout that makes a new high above the prior cup high.
- If the first projection long is missed, later entries can be planned above the next projected levels by adding the same box height again.
- A maximum $2 initial stop and the same $2 trailing stop bound the swing, while projected stall zones are used to skip buys that sit just under anticipated resistance.
Boxing the finished cup
A completed high-low box from a cup or consolidation can be used to estimate how far a new swing breakout is likely to travel before it consolidates or reverses. In this workflow a bullish cup is a U-shaped stretch of price with a visible rim high and trough low. That clearly defined top and bottom is boxed as a trading range, and the vertical span between those marks is the box trading range.
Once the rim is cleared, the same span becomes a price projection. The completed height is added above the cleared rim to estimate where the next swing may pause.
NVDA cup box and later 3-point breakout targets
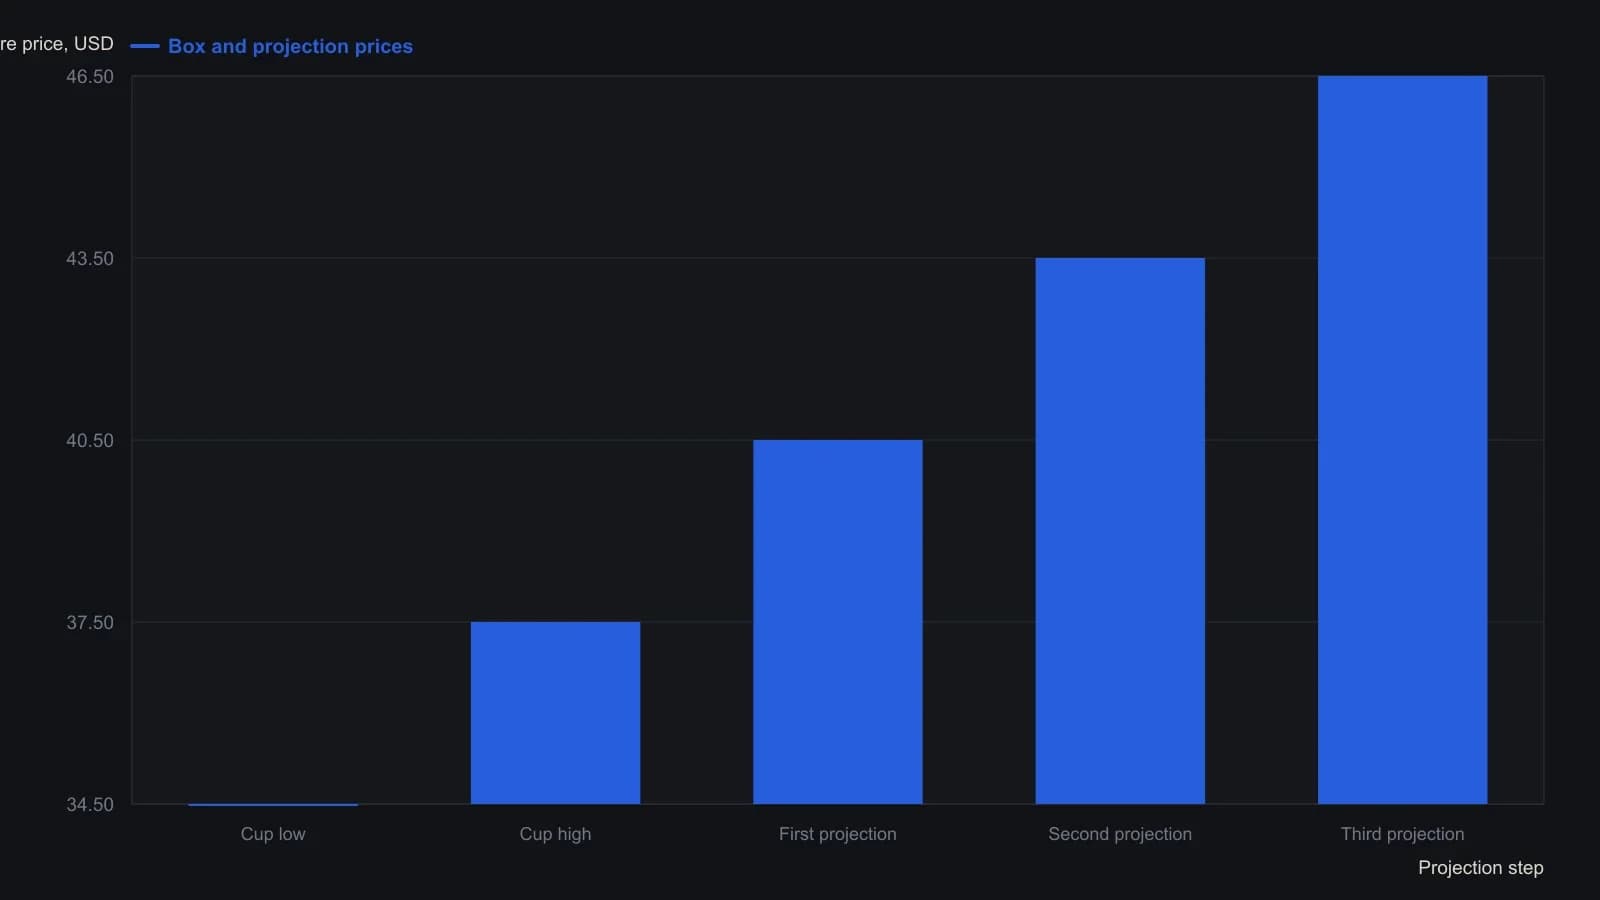
Cup high–low range is taken to the nearest 0.50 dollars, as the source method requires. The scan used 15-day 60-minute charts of stocks priced 20 to 70 dollars, with a maximum 2-dollar initial and trailing stop.
How the scan framed the cup
The scan uses 15-day 60-minute charts of shares priced from $20 to $70 and looks for a bullish cup in the first five to 12 days. The first cup high-low span is measured to the nearest $0.50, and that height is marked upward from the cup high as successive projection levels.
When a later high becomes a long
A long is considered on a later session after a gap or breakout that makes a new high above the prior cup high. That breakout is the gap or new high that clears the prior cup rim and opens a long hypothesis.
If the first projection long is missed, later entries can be planned above the next projected levels as the breakout trend continues. Each later projection is formed by adding the same box height to the previous projected price. That stepped mark is the Fibonacci projection used here: a measured continuation level formed by walking the completed range height forward from the rim or from the last projected price.
Stops, stalls, and skips
The plan applies a maximum $2 initial stop and the same $2 distance as a trailing stop on stock swing trades. The trailing stop is a protective exit that starts at that fixed maximum distance and follows the open swing.
Projected stall zones are used to skip buys that sit just under anticipated resistance and to stay out of failed breakouts. The zone just beneath a projected stall is a price exhaustion area, where a fresh long is more likely to meet resistance than to extend. A false breakout clears the rim but fails to follow through toward the next projected level.
All readings on this track · 18 readings
- 2001Constructing a Gartley from wave retracements
- 2001Constructing butterfly-spreads from a weekly impulse to daily D
- 2002Projected Fibonacci targets from breakout levels
- 2004Constructing wave-ratio clusters with Fibonacci and Gann
- 2006Third-wave impulse counts wait for a dated cluster
- 2006Wave and ratio checkpoints versus a dominant dollar story
- 2007A 2007 EUR/JPY news shock as a Fibonacci retest drill
- 2008Constructing Fibonacci retracement, projection, and range maps
- 2010Swing projection targets and support-backed put sales
- 2010Fibonacci clusters as a tight support or resistance decision
- 2011Fibonacci projections and money-flow divergence on a Dollar Index downswing
- 2011Crude oil wave confluence as a decision map
- 2016Box range projections for cup breakout entries
- 2018Fibonacci pinball and the 2016 election-week scoring drill
- 2019Named line-break rules for a wave count and Fibonacci map
- 2019Objective Fibonacci grids for support, retracement, and projection
- 2020Gold Super Cycle nested waves and Fibonacci bands
- 2020Intra-swing Fibonacci fitting and completion targets