2002issue C051-4
Projected Fibonacci targets from breakout levels
After a horizontal support or resistance break, four continuation levels are built from the first swing and the breakout origin. The later same-direction swing is scaled from that broken barrier, not from the start of the later swing.
- After a horizontal support or resistance break, four continuation levels are constructed from the ratio set of 23.6 percent, 38.2 percent, 50 percent, and 61.8 percent.
- Each level equals the chosen ratio times the first-swing start, minus the first-swing end, divided by that ratio minus one.
- The later same-direction swing is scaled from the breakout origin, not from the start of that later swing.
- The first projected level can be marked as a predefined review point rather than used alone.
Start from the breakout origin
After a horizontal support or resistance break, the violated barrier is the breakout origin: it links two same-direction swings and starts the measurement. The first swing is the completed A-to-B move that established the horizontal level later used in the formula. Support and resistance, in this construction, is a horizontal congestion zone that, once broken, is reused as the opposite barrier and as the B input in the projection.
The later same-direction swing is scaled from the breakout of the prior horizontal barrier, not from the start of that later swing. Fibonacci retracement here means reading that broken barrier as a known fraction of a larger swing so later reactions can be checked against 23.6 percent, 38.2 percent, 50 percent, or 61.8 percent.
Invert the retracement into four projections
Four continuation levels are then constructed from the ratio set: 23.6 percent, 38.2 percent, 50 percent, and 61.8 percent. Each level equals the chosen ratio times the first-swing start, minus the first-swing end, divided by that ratio minus one.
Fibonacci projection, in this workflow, means solving an unknown continuation extreme by rearranging the retracement identity around the first-swing start and the broken horizontal endpoint. The same four-ratio construction is applied after a downside support break as after an upside resistance break.
Use role reversal as a check
Role reversal is a former support that later caps a rally, or a former resistance that later cushions a decline, especially when that level also matches a Fibonacci retracement of the wider A-to-C swing. A former support that later acts as resistance can coincide with a 50 percent retracement of the full decline. In the schematic, a drop from 100 to 20 has that 50 percent level at 60.
In one worked downswing, a rebound from 35 to former support near 58 is about a 38.2 percent retracement of the 92-to-35 decline, because 57 times 0.382 plus 35 equals 56.77.
Worked continuation levels
For an upswing from 7400 to 8180, the four breakout projections are 8420, 8662, 8960, and 9440. For a downswing from 6951 to 5973, the four breakout projections are 5670, 5368, 4995, and 4391.
Using 23.6 percent on a first swing from 11750 to 9732 produces 9105. The illustrated series printed 9107 at that swing low, so the first projected level can be marked as a predefined review point rather than used alone.
FTSE 100 weekly with projected Fibonacci targets after support broke
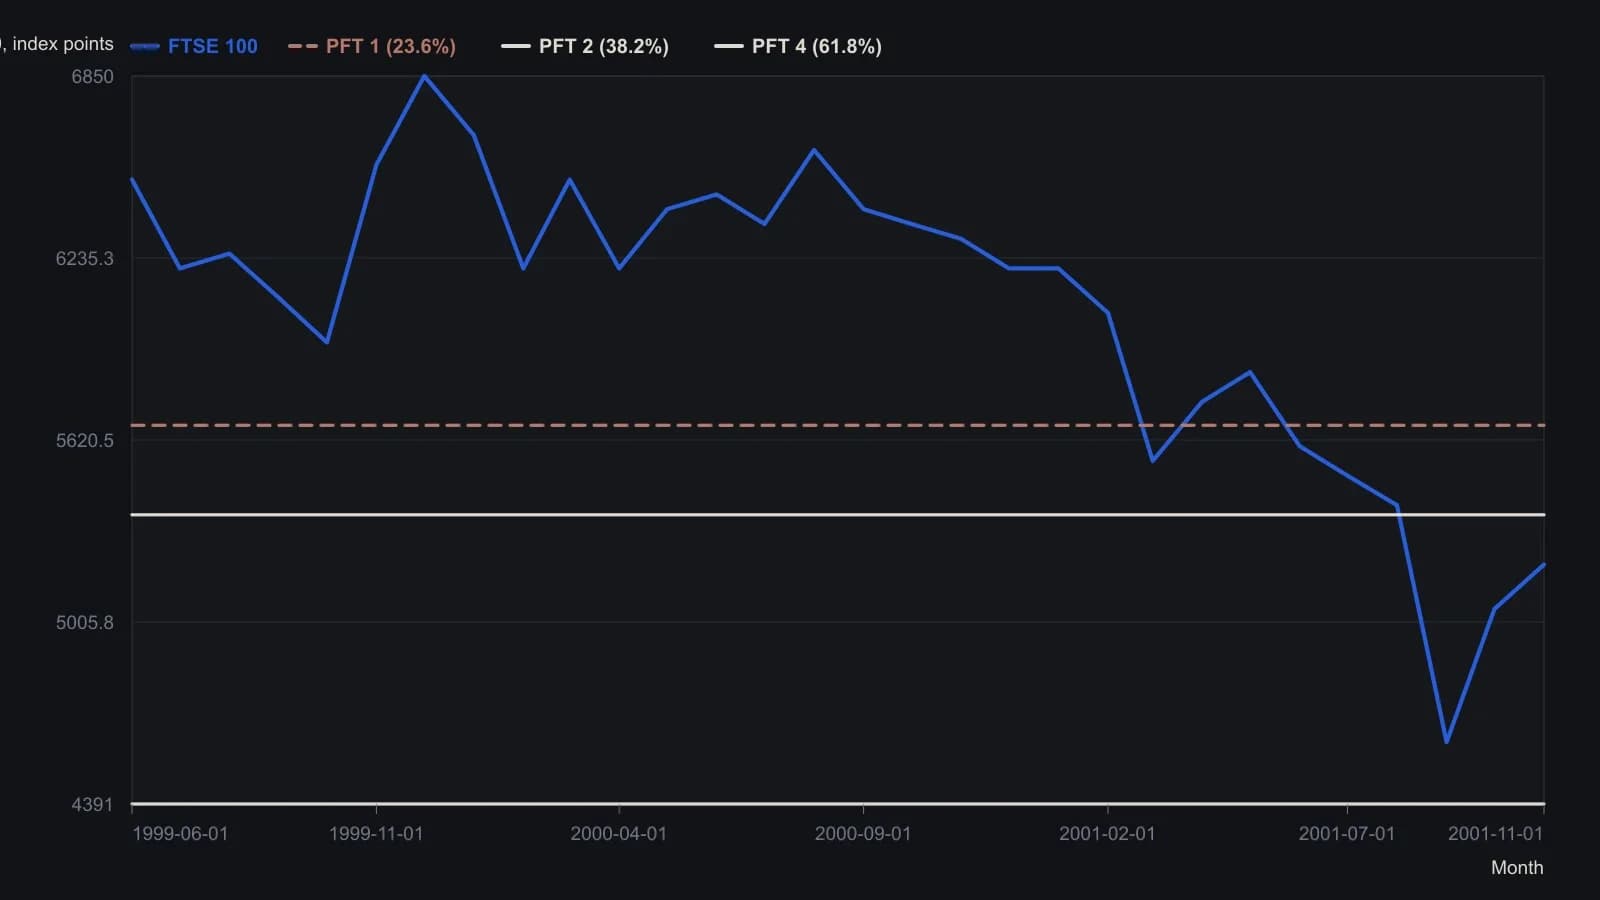
PFT = (ratio × A − B) / (ratio − 1) with A = 6951 and B = 5973. Price points are approximate monthly readings from the weekly raster, rounded to 50 index points. PFT 3 at 4995 is omitted from the overlay to stay within four series.
All readings on this track · 18 readings
- 2001Constructing a Gartley from wave retracements
- 2001Constructing butterfly-spreads from a weekly impulse to daily D
- 2002Projected Fibonacci targets from breakout levels
- 2004Constructing wave-ratio clusters with Fibonacci and Gann
- 2006Third-wave impulse counts wait for a dated cluster
- 2006Wave and ratio checkpoints versus a dominant dollar story
- 2007A 2007 EUR/JPY news shock as a Fibonacci retest drill
- 2008Constructing Fibonacci retracement, projection, and range maps
- 2010Swing projection targets and support-backed put sales
- 2010Fibonacci clusters as a tight support or resistance decision
- 2011Fibonacci projections and money-flow divergence on a Dollar Index downswing
- 2011Crude oil wave confluence as a decision map
- 2016Box range projections for cup breakout entries
- 2018Fibonacci pinball and the 2016 election-week scoring drill
- 2019Named line-break rules for a wave count and Fibonacci map
- 2019Objective Fibonacci grids for support, retracement, and projection
- 2020Gold Super Cycle nested waves and Fibonacci bands
- 2020Intra-swing Fibonacci fitting and completion targets