2006issue C101-4
A stated daily multiplier is a risk contract, not a return promise
Seven leveraged funds with beta-goal targets from 1.25 to 2.0 matched their indexes on realized beta and correlation-to-index, yet realized compounded returns lagged the theoretical-square-path and maximum-drawdown ran deeper than both the indexes and the idealized scaled models.
- Seven funds with at least five years of history kept realized betas close to beta-goal targets from 1.25 to 2.0, and correlation-to-index ran about 0.984 to 0.998.
- Realized annualized returns stayed below theoretical-square-path models, including a first case of -8.8% versus a theoretical -1.9%, while maximum-drawdown reached -75.2% versus -43.7% for the index and -68.3% on the theoretical scaled path.
- Imperfect day-count replication and a more negative tilt than the already-negative index tilt kept compounded results below the theoretical-square-path enhancement.
- Editorial view: a pre-entry leverage cap and an ongoing drawdown limit are the practical filters implied by that shortfall, because downside daily-roc sessions are scaled with upside sessions and the loss path can exceed even the theoretical scaled maximum-drawdown.
Close tracking did not bound the loss path
Seven funds with at least five years of history and beta-goal targets from 1.25 to 2.0 were compared with their indexes. Realized betas were close to those stated goals, and correlation-to-index ran about 0.984 to 0.998. The funds therefore matched the index sequence of up and down days closely enough that average beta looked on target.
The theoretical-square-path is not a doubled annual figure
Under an idealized daily-doubling example, a 10.46% index path would become about 21.9% if every daily-roc were scaled by 2. That result sits near the square of the index growth factor rather than a simple doubling of the annual figure.
Realized paths versus that baseline
In the first case, annualized return was -8.8% versus a theoretical -1.9%. Maximum-drawdown reached -75.2%, versus -43.7% for the index and -68.3% in the theoretical scaled path. Across the tabulated funds, realized annualized returns stayed below the theoretical scaled models, and realized maximum-drawdown exceeded both the indexes and those theoretical models.
Two mechanisms behind the shortfall
Imperfect day-count replication and a more negative tilt than the already-negative index tilt were identified as the two mechanisms that kept compounded results below the theoretical-square-path enhancement. Tilt is the gap between average up-session and down-session scaled returns, and a more negative gap reduces compounded growth.
A stronger return window still deepened drawdown
In a post-bear window from 9 October 2002 to 30 January 2006, one fund with a 1.5 beta-goal posted 25.2% annualized return and -22.1% maximum-drawdown, against 16.4% and -14.7% for the same index. The better return path still came with a larger drawdown.
Why a beta regression is not a survival test
A linear-regression check of realized versus stated beta is not enough for evaluation. Daily standard deviation rose with the leverage target, and the funds did not make the practical size of maximum-drawdown explicit beyond a general note that higher risk should be expected.
The filters implied by the shortfall
Because downside sessions are scaled along with upside sessions, a pre-entry leverage cap and an ongoing drawdown limit are the practical filters implied by the shortfall. The loss path can exceed even the theoretical scaled maximum-drawdown before the stated multiplier is judged a success.
Peak equity drawdown versus scaled daily-multiplier models and indexes
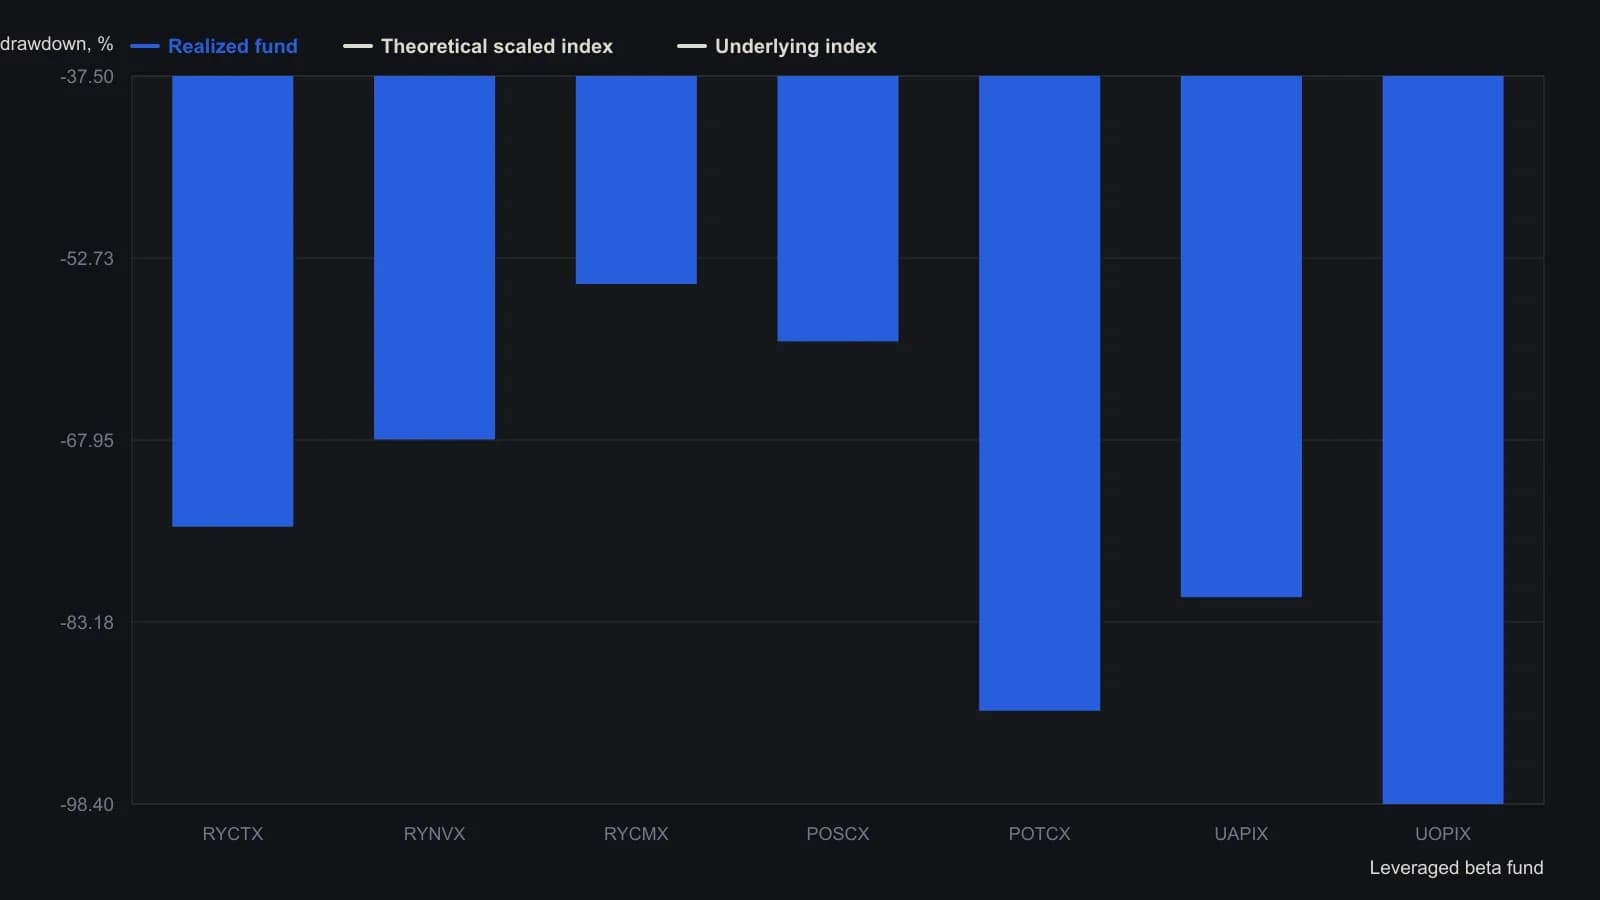
Sample windows differ by fund (about five to ten years). Theoretical rows are the author's scaled daily-ROC constructs at the stated beta, not live products.
All readings on this track · 22 readings
- 1992Probability stops from winning-trade drawdowns
- 1994Monthly drawdown limits when cash competes with equity
- 1994Keep constant leverage left of the equity peak
- 1995Evaluate mechanical systems as a three-way fit test
- 1997Limits as a single trading decision procedure
- 1998Drawdown limits before a trend system is allowed to trade
- 1998Evaluating trailing stops as two-parameter loss filters
- 1998Walk-forward evaluation of a noise-filtered bond-futures breakout
- 2002The pattern-day-trader equity floor as a leverage governor
- 2003Evaluating a one-rank mutual-fund switch
- 2004Keep entry, exit and abstention balanced as one procedure
- 2006A stated daily multiplier is a risk contract, not a return promise
- 2007Walk-forward probation for intraday systems
- 2008A mechanical futures procedure is unfinished without a drawdown limit
- 2010Evaluating mechanical index timing under drawdown limits
- 2013Predefined small losses outrank market analysis
- 2013Equity-curve filters as drawdown brakes
- 2014Critique of chasing recovery after a large drawdown
- 2015Loss thresholds and equilibrium as trade filters
- 2015Constructing mechanical systems under a drawdown cap
- 2018Evaluating system rules for robustness and livable drawdowns
- 2020Regime-aware equity halts and volatility entry filters