1994issue C051-10
Keep constant leverage left of the equity peak
Target leverage is a pre-entry size filter, not a reward for a recent winning streak. A daily constant-leverage-rebalance maps ending equity and worst-cumulative-drawdown as the multiple rises, then refuses any size past the historical peak or past a drawdown the trader cannot stay through.
- Leverage is position notional divided by trading equity, and a constant-leverage-rebalance resets that multiple every day after both gains and losses.
- For the same trading rule and market path, the return-versus-leverage-profile rose with leverage, then declined and turned negative past a historical peak.
- On a 200-day moving-average-position-filter, worst-cumulative-drawdown was 14.4 percent at leverage 1 versus 64.4 percent at leverage 5. Selling units after a leveraged loss to restore the target multiple cuts later recoveries.
- Stay left of the historical peak, leave a buffer in case later drawdowns are worse, and reject any leverage whose historical equity path exceeded endurance.
How leverage is defined
Leverage is position notional divided by trading equity, regardless of how much cash sits in the brokerage account versus a low-risk reserve. A 50000 position on 100000 of equity is 0.5, and a 100000 position on the same equity is 1.0. One S&P 500 futures contract at 450 with a 500 multiplier, backed by 100000 of equity, is 2.25 leverage, and a 1.0 percent price rise then changes equity by 2.25 percent.
Reset exposure to current equity
The applied-leverage setup uses a constant-leverage-rebalance. It resets exposure each day to a chosen multiple of current equity, not only at the start of a multi-day trade. After gains the position is scaled up. After losses, units are sold so exposure stays at the same multiple of the reduced equity.
How ending equity changed with leverage
The historical illustrations used daily S&P 500 futures from 1 January 1988 through 31 December 1993 and tracked an initial 100 of equity inside an account treated as large enough that unit-size rounding could be ignored.
On the always-long path, ending equity rose with leverage up to about 4.8 and then declined, with losses once leverage passed 9.
A 150-day moving-average-position-filter that was long only when price was above the average, otherwise flat, peaked near leverage 3.3 and turned negative past about 6.5.
A 200-day moving-average-position-filter peaked near leverage 5.2 and turned negative near 9.6. Worst-cumulative-drawdown was 14.4 percent at leverage 1 versus 64.4 percent at leverage 5.
Why deeper losses flatten the curve
Raising only the 13 October 1989 close from an 8.3 percent one-day loss to 12 percent or 20 percent, while leaving later prices unchanged, lowered peak ending equity and shifted the best leverage leftward, even though ending equity at leverage 1 stayed the same.
After a leveraged loss, selling units to restore the target multiple of reduced equity cuts participation in later recoveries, which is why deeper drawdowns flatten and left-shift the return-versus-leverage-profile.
200-day MA ending equity versus constant leverage
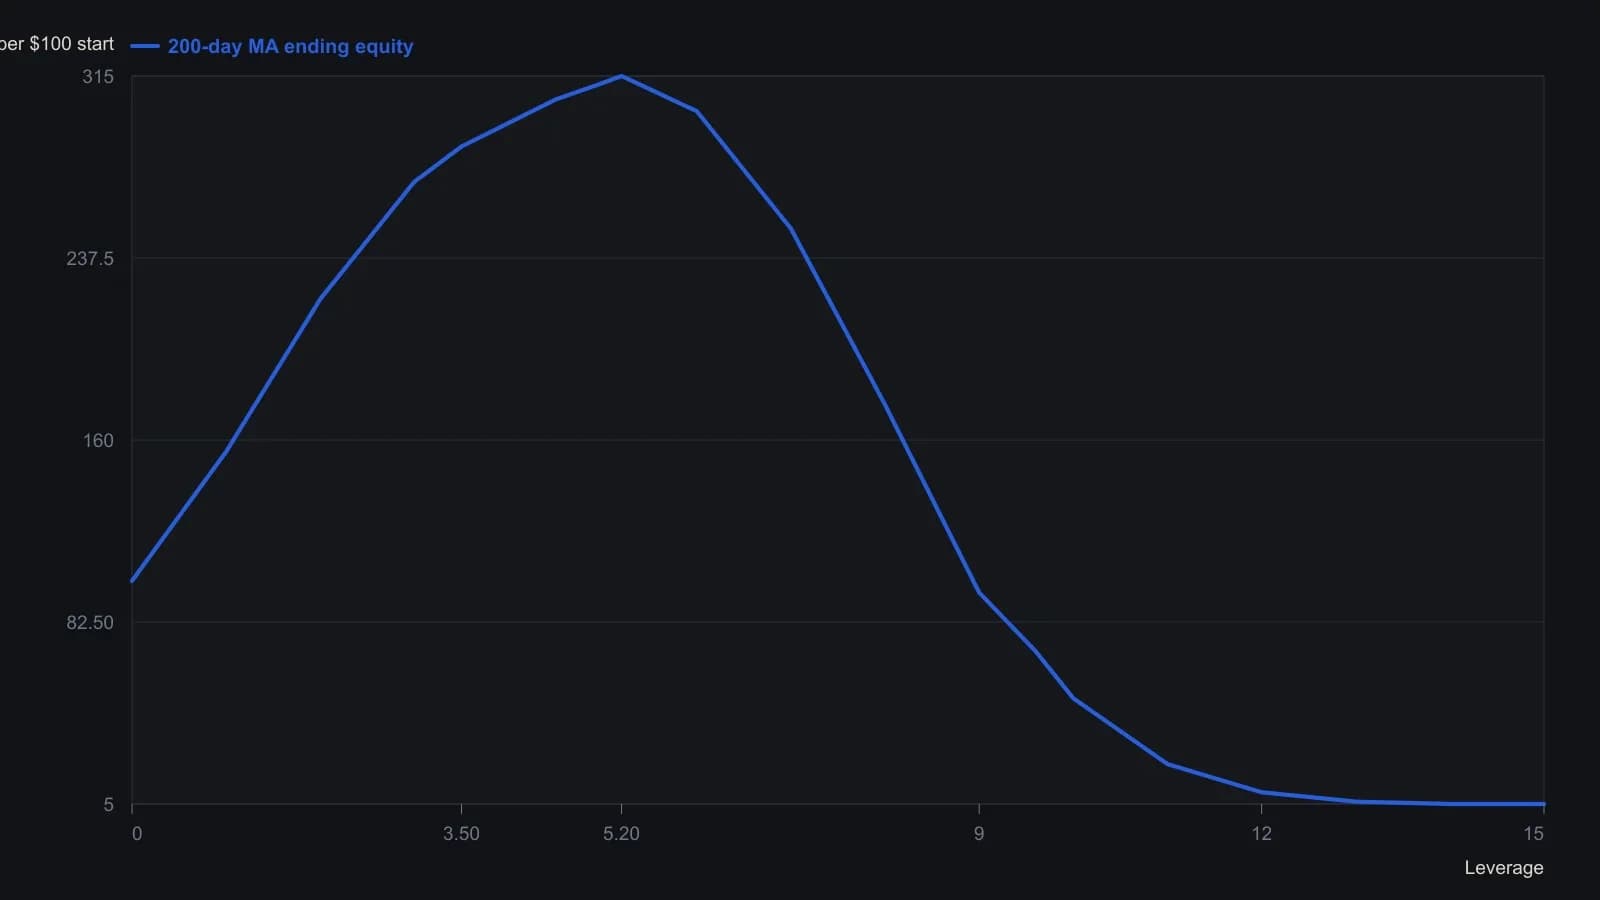
Leverage is reset daily to current equity. Digitized from the printed curve; the article states the peak at 5.2 and losses beyond about 9.6. Transaction costs ignored.
Stay left of the historical peak
The practical checklist is to stay left of the historical peak, leave a buffer below that peak in case later drawdowns are worse, and reject any leverage whose historical equity path exceeded the trader's endurance.
All readings on this track · 22 readings
- 1992Probability stops from winning-trade drawdowns
- 1994Monthly drawdown limits when cash competes with equity
- 1994Keep constant leverage left of the equity peak
- 1995Evaluate mechanical systems as a three-way fit test
- 1997Limits as a single trading decision procedure
- 1998Drawdown limits before a trend system is allowed to trade
- 1998Evaluating trailing stops as two-parameter loss filters
- 1998Walk-forward evaluation of a noise-filtered bond-futures breakout
- 2002The pattern-day-trader equity floor as a leverage governor
- 2003Evaluating a one-rank mutual-fund switch
- 2004Keep entry, exit and abstention balanced as one procedure
- 2006A stated daily multiplier is a risk contract, not a return promise
- 2007Walk-forward probation for intraday systems
- 2008A mechanical futures procedure is unfinished without a drawdown limit
- 2010Evaluating mechanical index timing under drawdown limits
- 2013Predefined small losses outrank market analysis
- 2013Equity-curve filters as drawdown brakes
- 2014Critique of chasing recovery after a large drawdown
- 2015Loss thresholds and equilibrium as trade filters
- 2015Constructing mechanical systems under a drawdown cap
- 2018Evaluating system rules for robustness and livable drawdowns
- 2020Regime-aware equity halts and volatility entry filters