1987issue C091-6
Underwriting a seasonal livestock calendar spread
A seasonal feeder-cattle calendar spread became portfolio-eligible only after dollar screens for size, reliability, and consistency. Unlike legs were ranked in dollars, every quarter-month entry-exit pair sat on one grid, and the worst intra-window equity dip informed the loss cap used on that slot.
- A seasonal commodity spread became portfolio-eligible only after three historical screens: dollar profitability large enough to compare with margin and stop distance, multi-year reliability, and profit consistency not dominated by a single outlier year.
- Unlike but related contracts were ranked in dollars. A price-unit comparison was treated as meaningless when units differed, as with 44,000 lb feeder cattle versus 40,000 lb live cattle.
- Each quarter-month entry-exit pair was scored on one matrix of average dollars and winning frequency so an average produced by a single extreme year could be rejected.
- Year-by-year printouts recorded the worst intra-window equity dip, and that dip informed a hard drawdown limit used to exit a strong contra-seasonal break.
A book slot, not a spotted window
The archive treated a seasonal commodity spread as portfolio-eligible only after three historical screens. Dollar profitability had to be large enough to compare with margin and stop distance. The window needed multi-year reliability. Profit consistency could not be dominated by a single outlier year.
The case-study vehicle was a calendar spread: a same-commodity position that is long one delivery month and short another. Here that meant long March feeder cattle versus short November feeder cattle.
Unlike legs ranked only in dollars
Results were required in dollars so unlike but related contracts could be ranked together. When units differed, as with 44,000 lb feeder cattle versus 40,000 lb live cattle, a price-unit comparison was treated as meaningless.
A dollarized spread converted each leg to currency with its contract multiplier so unlike commodities or unequal units could be ranked on one scale. Dollarization in this case used a 440 multiplier. A 1.40 March-over-November average price on Aug. 31 mapped to 616 dollars, and that increment reappeared in the matching entry-exit cell.
Reliability that still allowed a losing year
The reliability screen was a multi-year hit-rate check used to reject windows that rarely finished ahead in the sample. The bar used in the procedure was a 10-year historical win frequency of about 7 years in 10, with an explicit statement that every seasonal spread can produce a contra-seasonal loss in some year. A contra-seasonal move is a year in which the spread moves against the historical seasonal window.
A consistency screen checked that an attractive average was not produced by one extreme year plus many near-flat years. Many spread slots held through the year were the stated way to limit the book-level effect of any one contra-seasonal failure.
Every quarter-month pair on one grid
The March-November feeder-cattle calendar spread was scored on an entry-exit matrix: a quarter-month grid of assumed open dates versus close dates from late August through mid-November. Weekend or holiday dates rolled to the next session close. A quarter-month is a date-grid unit of about 7.5 days, with 48 such units in a year versus 52 weeks.
Each matrix cell stored average dollars left of a slash and winning frequency to the right. Over nine years the Aug. 22-Aug. 31 cell averaged a 237-dollar loss at 22 percent, while the Sept. 15-Oct. 31 cell averaged a 628-dollar gain at 100 percent.
Nine-year average dollar value of the March–November feeder cattle spread
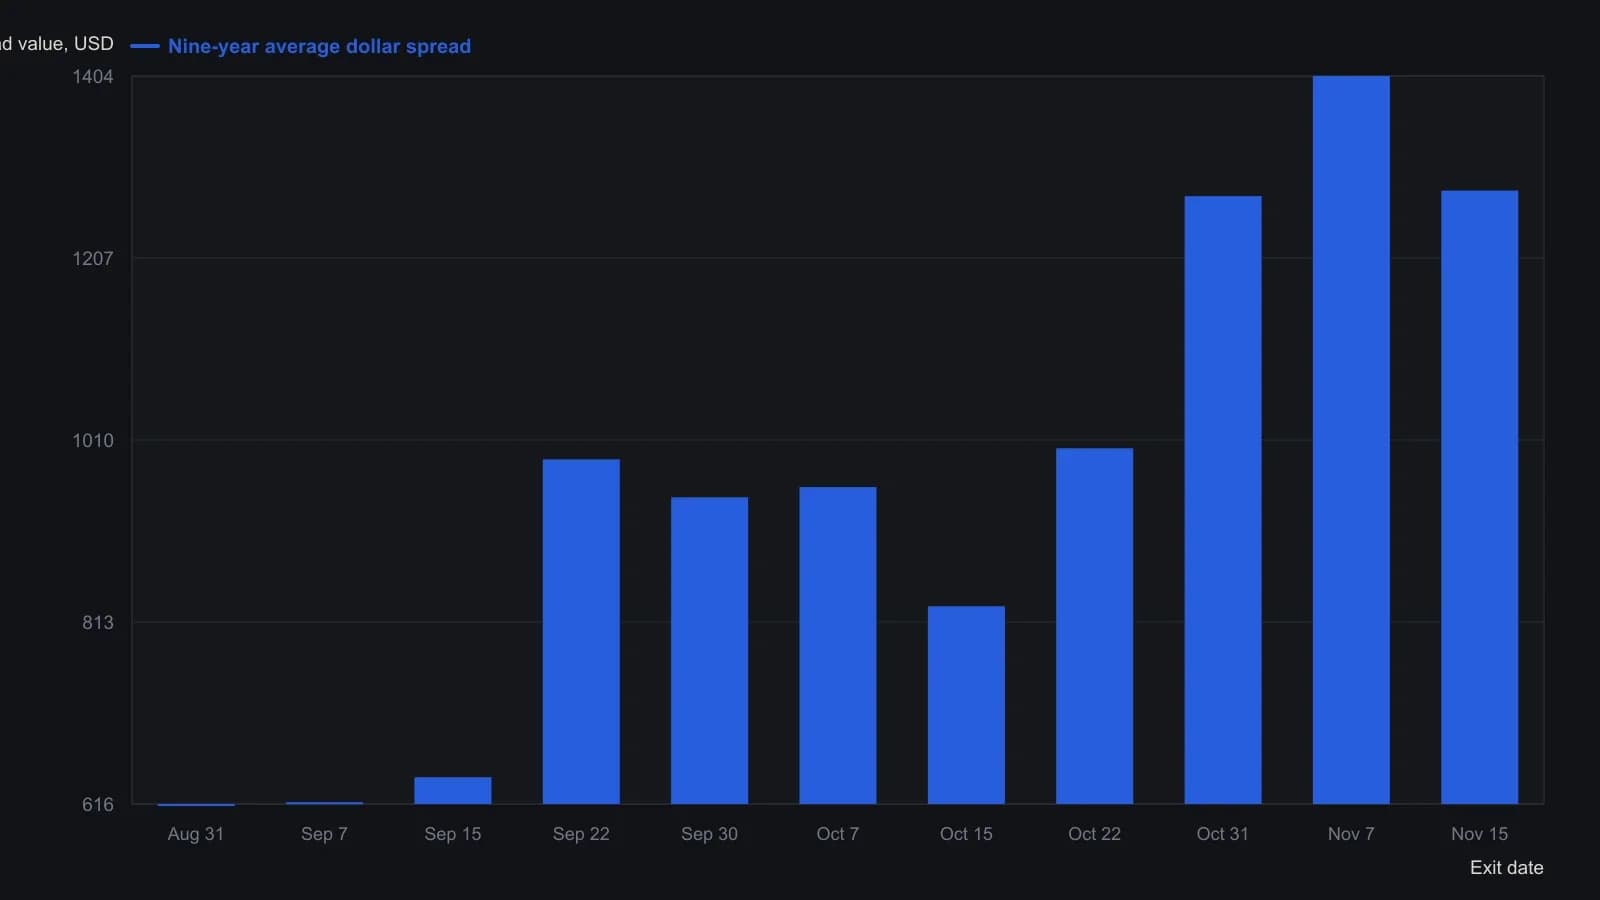
Each column is a quarter-month close (about 7.5 days, next session if the date is a weekend or holiday). Dollar value is the printed price spread times the 440-unit feeder-cattle contract. Years are the March-contract seasons 1979–1987.
The worst intra-window dip as the loss cap
Year-by-year printouts split each window into long-leg, short-leg, and combined dollar results and recorded the worst intra-window equity dip. Intra-trade drawdown is the worst mark-to-market result if the spread had been closed at the most adverse point between planned entry and planned exit. 1982 showed a 946-dollar worst dip and a 297-dollar closed result.
Across nine years the worst intra-trade drawdown was 946 dollars and the average drawdown was 244 dollars. A 1,000-dollar cap would have contained every dip in that sample. A 1,000-dollar adverse move was treated as a strong contra-seasonal break requiring exit unless a separate reason to stay existed.
That drawdown limit is a hard loss cap informed by the sample's worst intra-window dip, used to exit a break that no longer looks like the seasonal window.
Margin plus average drawdown as the capital base
The example spread margin was 200 dollars versus 1,600 dollars for two outright feeder-cattle contracts. Slot comparison used margin plus average drawdown as the capital base in the ratio 628 / (200 + 244).
All readings on this track · 17 readings
- 1987Seasonal commodity spreads as portfolio slots
- 1987Underwriting a seasonal livestock calendar spread
- 1987Calendar gates for outright seasonal portfolios
- 1988Relative strength spreads against a commodity index
- 1989Evaluating mechanical seasonal date rules for commodity spreads
- 1991Regime gates for intermarket and spread trades
- 1997A decision-logic filter for the July-November soybean spread
- 1997Seasonal wheat and corn spread windows
- 1997Seasonal filters for corn-wheat spread breakouts
- 1998Be rich or be right: when only a written checklist counts as a system
- 1998Seasonal stock-index windows beyond the January effect
- 1999Same-maturity quality sleeves from a credit tunnel
- 2002Intraday sector pairs hedged as one spread
- 2006Seasonal regimes versus one-off news in commodity and rate spreads
- 2006Calendar spreads as an unknown-fundamentals regime filter
- 2008Placing early 2008 grain futures on a historical range map
- 2017Quiet tape as a construction window for multi-leg energy spreads